
Chapter 17 ~ Atmospheric Gases and Climate Change
Key Concepts
After completing this chapter, you will be able to:
- Outline the physical basis of Earth’s greenhouse effect, and describe how human influences may be causing it to intensify.
- Explain the term greenhouse gas (GHG).
- Describe how the various GHGs vary in their effectiveness and influence on the greenhouse effect.
- Identify which GHGs have been increasing in concentration in the atmosphere, and give the reasons for those changes.
- Explain the probable climatic consequences of an intensification of the greenhouse effect, and describe possible economic and ecological effects.
- Discuss strategies for reducing the intensity of the human influence on the greenhouse effect.
Introduction
In this chapter we examine how Earth’s naturally occurring greenhouse effect keeps the surface of the planet relatively warm. We also describe how certain atmospheric constituents influence this phenomenon. These constituents are known as greenhouse gases (GHGs) and they work by slowing the rate by which Earth is able to cool itself of absorbed solar radiation. It is well documented that the concentrations of some of the GHGs, particularly carbon dioxide, are increasing because of emissions associated with various human activities. Potentially, these increased concentrations could intensify the greenhouse effect, which would result in global warming. This would be an extremely important environmental change, with potentially devastating consequences for the human economy and natural ecosystems.
The Greenhouse Effect
Earth’s greenhouse effect is a well-understood physical phenomenon, and it is critical in maintaining the average surface temperature of the planet at about 15°C. Without this influence, the surface temperature would average about -18°C, or 33° cooler than it actually is. This would be frostier than organisms could tolerate over the long term, because at -18°C water is in a solid state. Liquid water is crucial to the proper functioning of organisms and ecosystems. At Earth’s actual average temperature of 15°C, water is unfrozen for much or all of the year (depending on location). This means that enzymes can function and physiology can proceed efficiently, as can the many important ecological processes that involve liquid water.
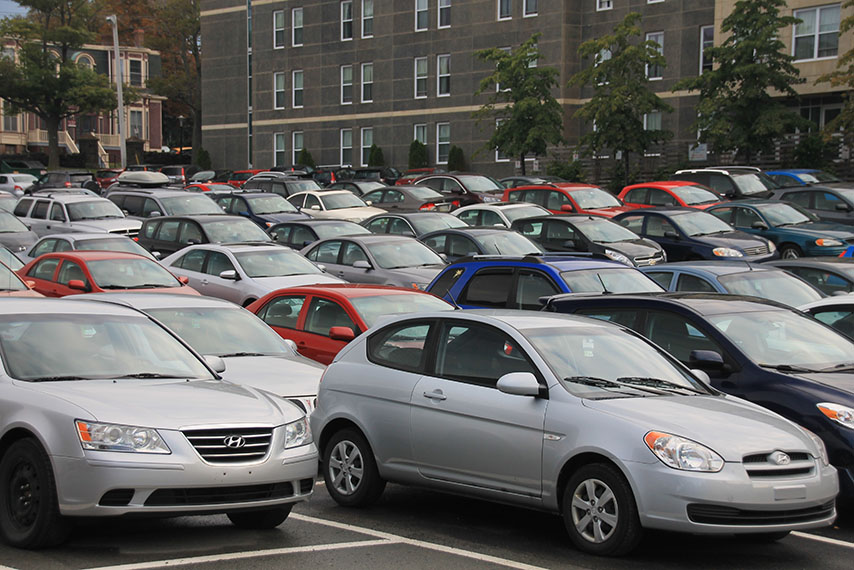
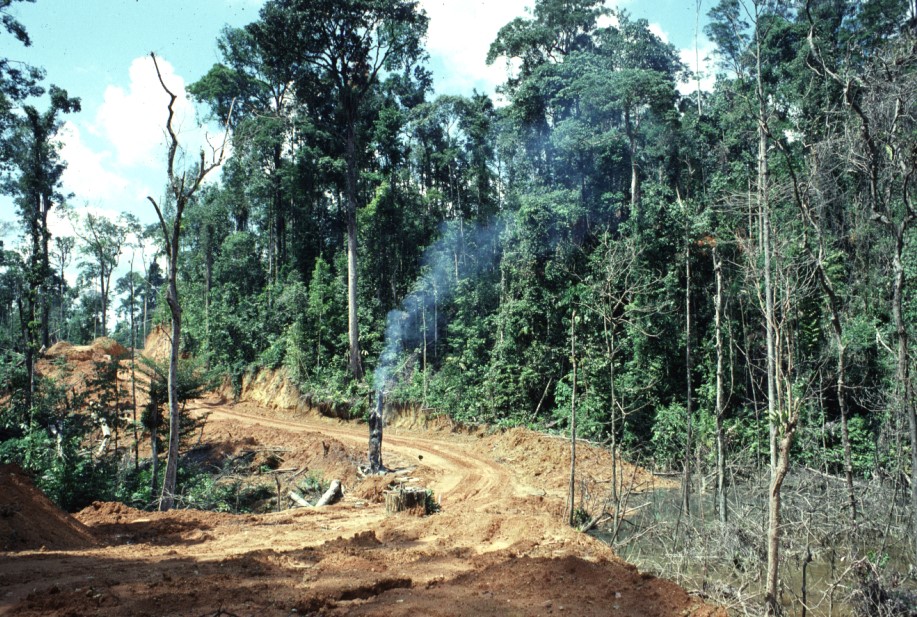
Image 17.1. The combustion of fossil fuels for transportation and commercial energy is the leading anthropogenic source of emissions of carbon dioxide to the atmosphere. Source: B. Freedman.
To understand the nature of Earth’s greenhouse effect, it is necessary to comprehend the planet’s energy budget. As we examined in Chapter 4, an energy budget is a physical analysis that deals with the following:
- all of the energy coming into a system
- all of the energy going out
- any difference that might be internally transformed or stored
Solar electromagnetic radiation is the major input of energy to Earth. On average, this energy arrives at a rate of about 8.4 J/cm2•min. Much of the incoming solar radiation penetrates the atmosphere and is absorbed by the surface of the planet. However, the surface temperature does not increase excessively because Earth dissipates the absorbed solar energy by emitting long-wave infrared radiation. The surface temperature is determined by the equilibrium rates at which (1) solar energy is absorbed by the surface, and (2) the absorbed energy is re-radiated in a longer-wavelength form (see Figure 4.2 for a diagram of the greenhouse effect).
If the atmosphere were transparent to the long-wave infrared radiated by the surface, then that energy would travel unobstructed to outer space. However, this is not the case because so-called greenhouse gases (GHGs; also known as radiatively active gases or RAGs) are present in the atmosphere. GHGs efficiently absorb infrared radiation, and become heated as a consequence. They then dissipate some of this thermal energy through yet another re-radiation. (This re-radiated energy has a longer wavelength than the electromagnetic energy that was originally absorbed. This is necessary to satisfy the second law of thermodynamics.) The re-radiated energy of the GHGs is emitted in all directions, including back toward the surface. The net effect of the various energy transformations and re-radiations involving atmospheric GHGs is a reduction in the rate of cooling of Earth’s surface. Thus, the equilibrium temperature of the planet’s surface is warmer than it would be if the GHGs were not present in the atmosphere.
The process just described is known as the greenhouse effect because its physical mechanism is similar to the warming of a glass-encased space by solar radiation. The encasing glass of a literal greenhouse is transparent to incoming solar radiation. The solar energy is absorbed by, and therefore heats, internal surfaces of the greenhouse, such as plants, soil, and other materials. These warmed objects then dissipate their absorbed energy by re-radiating longer-wave infrared energy. However, much of the infrared is absorbed by the glass and humid atmosphere of the greenhouse, which are somewhat opaque to those wavelengths of electromagnetic radiation. That absorption of some re-radiated infrared slows the rate of cooling of the greenhouse, causing it to heat up rapidly on sunny days. (In addition, a greenhouse is an enclosed space, so it traps heat because its warmed interior air cannot be dissipated by convection higher into the atmosphere, with cooler air drawn in below.)
Radiatively Active Gases
Water vapour (H2O) is the most important of the radiatively active constituents of Earth’s atmosphere, accounting for about 36% of the overall greenhouse effect, followed by carbon dioxide (CO2; about 20%). Lesser roles are played by trace concentrations of methane (CH4), nitrous oxide (N2O), ozone (O3), carbon tetrachloride (CCl4), and chlorofluorocarbons (CFCs).
These latter compounds are, however, much stronger absorbers of infrared energy than is CO2 (on a per molecule basis, they are more efficient GHGs). A molecule of CH4 is about 28 times more effective than one of CO2 at absorbing infrared radiation, while N2O is 265 times more effective (these are known as greenhouse warming potentials, with CO2 assigned a value of 1.0; Table 17.1).
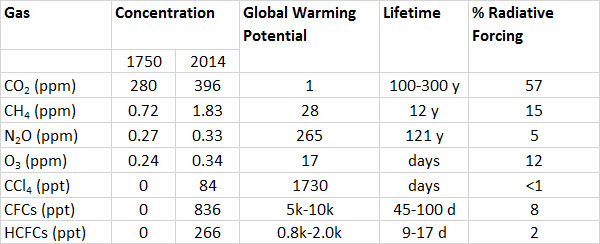
There is no evidence that the concentration of water vapour in the atmosphere has increased recently. However, concentrations of CO2 and other GHGs have increased markedly during the past several centuries because of emissions associated with human activities (Table 17.1). Prior to 1750, the atmospheric concentration of CO2 was about 280 ppm, whereas in 2014 it had reached 399 ppm, which is a 43% increase. Other GHGs have also increased during this period. The increases have been especially rapid since the middle of the twentieth century, coinciding with enormous increases in population, industrialization, and deforestation.
Because the various GHGs are known to influence the greenhouse effect, it is reasonable to hypothesize that their increasing concentrations will intensify that process. A stronger greenhouse effect could lead to global warming. Such an environmental change should be viewed as being an anthropogenic intensification of Earth’s naturally occurring greenhouse effect. Overall, the increased concentration of CO2 is estimated to account for about 57% of this possible enhancement of the greenhouse effect, while CH4 is responsible for 15%, tropospheric O3 for 12%, halocarbons for 8%, and N2O for 5% (Table 17.1).
Table 17.1. Increases and Characteristics of Greenhouse Gases. Source: Data from Blasing, 2014.
Atmospheric Carbon Dioxide
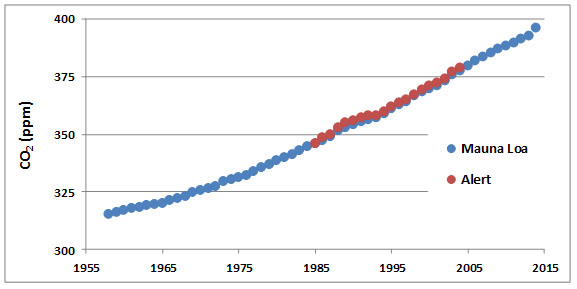
Concentrations of CO2 in the atmosphere have been increasing steadily for at least the past century. The data record supporting this change is excellent and demonstrates one of the most convincing examples of long-term changes of any aspect of environmental chemistry. For example, atmospheric CO2 has been monitored continuously since 1958 at a remote observatory located on Mauna Loa, a mountain on the island of Hawaii (Figure 17.1). Data are also shown for Alert, a high-Arctic station located at the northern tip of Ellesmere Island, Nunavut. The data from both places clearly show steadily increasing concentrations of CO2 in the atmosphere during the past five decades.
Figure 17.1. Increases in Atmospheric CO2. These data are from measurements made on an equatorial station on Mauna Loa, Hawaii, and in the High Arctic in northern Ellesmere Island, Nunavut. Each datum represents an annual average. Note that prior to 1750, the concentration of CO2 in the atmosphere was about 280 ppm (see text). Source: Data from Keeling et al. (2014).
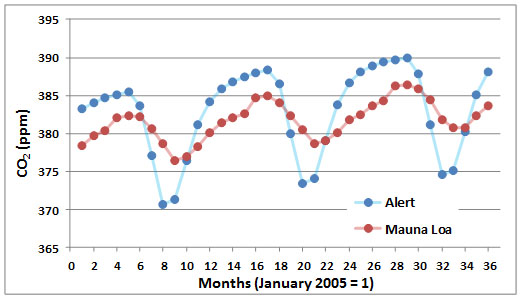
A seasonal cycle of CO2 concentration is illustrated in Figure 17.2, again using data from Mauna Loa and Alert. The annual periodicity is caused by high rates of CO2 uptake by vegetation of the Northern Hemisphere during the growing season. This seasonal CO2 fixation occurs at rates that are high enough depress its overall concentration in the global atmosphere. The effects if larger in the Arctic than at the Equator, although both regions have the same annual average concentration of CO2.
Figure 17.2. Seasonal Changes in Atmospheric CO2. These data are based on measurements made at Mauna Loa, Hawaii, and Alert, Ellesmere Island. Source: Data from Keeling et al. (2008, 2014).
The increased concentrations of atmospheric CO2 are due to emissions associated with various human activities. The two most important sources of anthropogenic emissions are examined in more detail in the following sections:
- the combustion of fossil fuels, during which the carbon content of the fuel is oxidized to CO2, which is emitted to the atmosphere
- deforestation, an ecological conversion in which mature forests that store large amounts of organic carbon are converted into ecosystems that contain much less, with the difference being made up by a released of CO2 to the atmosphere
CO2 from Fossil Fuels
Fossil fuels are the most important source of energy in industrialized countries, followed by hydroelectricity, nuclear power, and relatively minor sources such as wood, solar, and wind energies (Chapter 13). The rates of utilization of coal, petroleum, natural gas, and oil sand have increased enormously during the past century, mostly to satisfy surging energy demands for industry, transportation, and space heating. The manufacturing of cement also results in large emissions of CO2 to the atmosphere.
In total, since about the beginning of the Industrial Revolution in 1750, about 365-billion tonnes of CO2-C (carbon in the form of CO2) have been released to the atmosphere from the consumption of fossil fuels and the production of cement (Boden et al., 2013). Half of these fossil-fuel CO2 emissions have occurred since the mid-1980s.
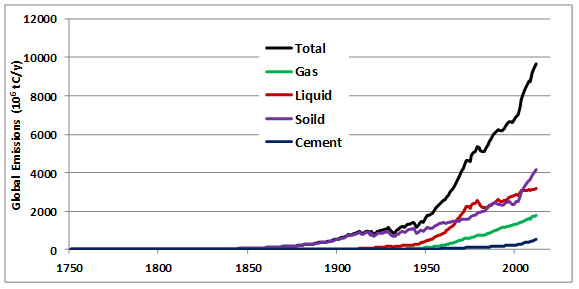
Between 1860 and 1869, during the middle part of the Industrial Revolution, the combustion of fossil fuels, mainly coal, resulted in the global emission of about 422-million tonnes of CO2 per year (Boden et al., 2013). By the year 2012, global emissions from fossil-fuel combustion had increased by a factor of 80, to 35.4 billion tonnes per year (Figure 17.3). About 95% of the commercial emission of CO2 in 2012 was due to the combustion of fossil fuels, of which 43% was from liquid hydrocarbons, 33% from coal, and 18% from natural gas. The remaining 5% is associated with cement manufacturing and gas flaring (Table 17.2).
Figure 17.3. Global CO2 Emissions by Major Sources. Source: Data from Boden et al. (2013).
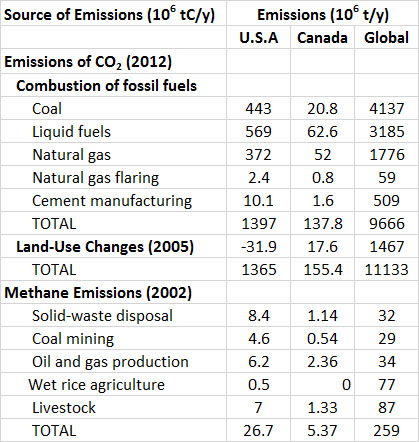
Table 17.2. Global and North American Emissions of Carbon Dioxide and Methane. Source: CDIAC (2015).
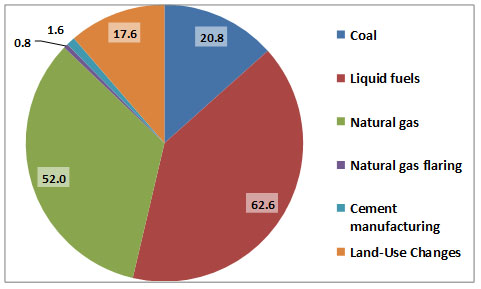
Figure 17.4. Major Sources of CO2 Emissions to the Atmosphere in Canada. Data are for 2004 and are in 106 tC/y. Data for coal, petroleum, and natural gas are related to combustion sources, while land-use changes are mostly disturbances of natural ecosystems. Source: Data from CDIAC (2015)
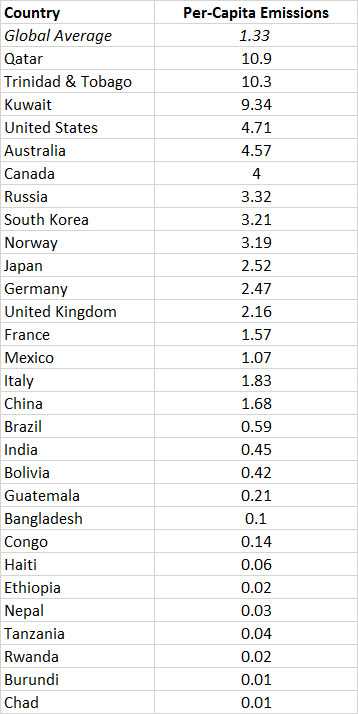
The global commercial emissions are equivalent to about 1.3 tCO2/person•year (in 2010; Table 17.3). Of course, per-capita use of fossil fuels differs greatly among countries, depending on their kind and degree of industrialization, types of energy sources, climate, and other factors. The largest per-capita emissions are in several countries that flare large amounts of fossil fuels at wellheads and refiners, such as Qatar and Trinidad & Tobago. Other than those cases, the greatest emissions are in wealthy, energy-intensive countries, such as Canada, Australia, the United States, Japan, and most of Western Europe. The smallest emissions are in the poorest, least-developed countries, where there is relatively little use of fossil fuels because of the expense to purchase them.
Table 17.3. Per-Capita Emissions of CO2 by Selected Countries. Data are for commercial sources of emission (mostly fossil fuels), in units of tonnes of CO2-C per person•year in 2010. Source: Data from Boden et al. (2014).
Future emissions of CO2 from fossil-fuel combustion are predicted to be much larger than those occurring today, mainly because of the anticipated industrialization of poorer countries as they develop economically. One prediction suggests that global emissions by the middle of the twenty-first century could be up to 55 billion tonnes of CO2 per year, about double the current releases.
CO2 from Clearing Forest
Mature forest stores large amounts of organic carbon in vegetation and the dead organic matter of soil. All other kinds of ecosystems, including younger forests that are regenerating from a disturbance, store much less organic carbon than occurs in older forests. This observation suggests that whenever an area of mature forest is disturbed by timber harvesting, or is cleared to provide land for agricultural or urbanized use, much less organic carbon will be stored on the land.
If a harvested stand is allowed to regenerate to another mature forest, then the depletion of stored carbon will be a medium-term phenomenon. However, if forest is converted into an anthropogenic land-use, such as for agriculture or urbanization, there is a permanent loss of carbon stored on the land. In either case, the difference in the average quantity of organic carbon stored in the ecosystem is balanced by an emission of CO2 to the atmosphere. The CO2 release mostly occurs by decomposition of the forest biomass or by burning. To a lesser degree, and for similar reasons, a carbon loss also occurs when natural grassland is converted into cultivated agriculture.
It is well known that humans have caused enormous reductions in the area of mature forest in most regions of the world (Chapters 12 and 14). These changes began slowly, initially perhaps with the domestication of fire and its widespread use to improve the habitat of hunted animals. Deforestation proceeded more rapidly when it was discovered that fertile agricultural land could be developed by removing the natural cover of forest or grassland. (The harvested trees were also valuable commodities.) Deforestation has proceeded especially quickly during the past several centuries because of population growth, agricultural expansion, and industrialization.
Prior to any substantial clearing of Earth’s natural forests, the global terrestrial vegetation stored an estimated 900-billion tonnes of organic carbon (Figure 17.5). About 90% of that carbon was stored in forest, of which half was in tropical forest. Now, only about 560-billion tonnes of carbon are stored in terrestrial vegetation, a 38% decrease. Moreover, the stocks of global biomass are diminishing further as more-and-more natural ecosystems are converted into agricultural and urban ones that store much less carbon.
During the 143-year period from 1870 to 2013, changes in land-use (mostly conversions of forest into agricultural land) resulted in the emission of about 145-billion tonnes of CO2-C. This quantity is about 45% of the emissions due to fossil fuel combustion during the same period (320-billion tonnes of CO2). More recently, in 2013, the combustion of fossil fuels emitted about 9.9-billion tonnes of CO2-C into the atmosphere, while deforestation accounted for another 0.9-billion tonnes.
As was previously noted previously, forest and grassland ecosystems store large amounts of carbon in the biomass of their vegetation and soil. When these “high-carbon” ecosystems are converted into agricultural or urban ones, there is a large emission of their organic carbon to the atmosphere (mostly as CO2 from decomposition and fires).
The disturbance of forests by harvesting timber also results in a large emission of CO2, because mature stands support much more biomass than younger ones (old-growth forest stores the most). However, the carbon emission scenario is complicated by what is done with the harvested timber. For example, if the tree biomass is burned as a fuel, the release of CO2 to the atmosphere occurs rapidly. On the other hand, if the harvested wood is used to manufacture lumber, furniture, or violins, all of which are “enduring” products with an extended lifespan, the release of CO2 to the atmosphere occurs slowly. It must also be remembered that much of the initial release of CO2 may eventually be offset by regeneration of the harvested forest (unless this is prevented, as happens when deforestation occurs to develop agricultural or urban land-use).
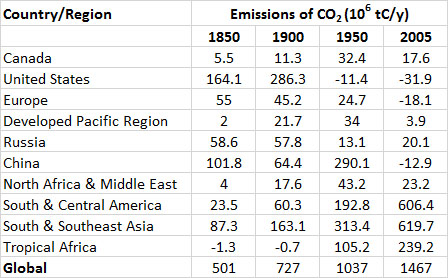
Table 17.4 shows large differences between regions in their emissions of CO2 from changes in land-use. In North America, extensive forest clearing began when the continent was colonized by Europeans and continued until the 1920s. Since then, however, large areas of marginally economical agricultural land have been returned to forest. Overall, the net emission of CO2 by changes in forest area has recently been close to zero—that is, agricultural land is regenerating back to forest about as quickly as forest elsewhere in North America is being converted into agricultural and urban land-uses. The European situation is similar, and forest biomass (and carbon storage) there has also increased since the 1920s.
However, in relatively poor, less-developed, tropical countries of Africa, Asia, and Latin America, forests are being cleared rapidly. This is being dome mostly to develop agricultural land to provide livelihoods and grow food for increasing numbers of people, and also to provide agriculture commodities for export. This is a serious problem not only because of the large emissions of CO2, but also because of the consequences for biodiversity (Chapter 26).
Fortunately, there are signs that the rate of global deforestation may be slowing down. It appears to have reached a peak in the 1990s, when the resulting carbon emissions from deforestation and other land-use changes was about 1.6 x 10⁹ tC/y, and has slowed to 0.9 x 10⁹ tC/y from 2004-2013 (Global Carbon Budget (2014).
Image 17.2. The conversion of carbon-dense ecosystems, such as forest, into agricultural and urban ecosystems that store much less carbon is an important source of CO2 emissions. This site on Sumatra has had its tree cover felled and the woody debris burned. The land will be planted with a variety of crops. Deforestation is proceeding rapidly in this region of Indonesia, and in most tropical countries. Source: B. Freedman.
Table 17.4. Net Emissions of CO2 to the Atmosphere as a Result of Land-Use Changes. Negative numbers indicate that carbon stored in ecosystem biomass is increasing. Source: Data from Houghton (2008).
Overall, in modern times, most CO2 emissions associated with deforestation have been occurring in less-developed tropical countries. In contrast, most CO2 emissions from the combustion of fossil fuels have been occurring in relatively wealthy, industrialized, higher-latitude countries, of which Canada is a leading example.
Global Carbon Geochemistry
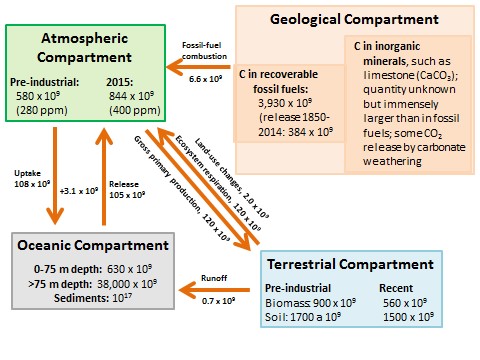
Key anthropogenic influences on the global carbon budget are summarized in Figure 17.5, which shows the major compartments in which carbon is stored as well as transfers between them. Although Figure 17.5 simplifies the complex nature of the global carbon cycle, some important inferences can be made that are relevant to the greenhouse effect.
Anthropogenic emissions have caused a 43% increase to occur in the amount of CO2 stored in the atmosphere, from about 580 x 109 t of CO2-C in pre-industrial times to 844 x 109 t in 2015. The atmospheric concentration of CO2 has accordingly increased during the same period, from about 280 ppm to 400 ppm.
Before humans began to modify the character of Earth’s ecosystems, especially by extensive deforestation, the global emission and fixation of atmospheric CO2 were approximately in balance. In other words, on a global basis, the gross primary production (GPP) was about equal to ecosystem respiration (ER), and biologically fixed carbon was not changing over time. However, deforestation is now resulting in huge emissions of CO2, amounting to about 2.0 x 10⁹ t/y of CO2-C. Overall, modern terrestrial ecosystems are storing about 38% less carbon in their vegetation and 12% less in soil compared with pre-industrial times.
Ultimately, the oceans are the most important sink for CO2 emitted through human activities. The oceans have a net absorption of about 3.1 x 10⁹ t/y of CO2-C from the atmosphere. However, this is much less than the anthropogenic emissions of 8.6 × 10⁹ t/y of CO2-C, and so the amount of CO2 stored in the atmosphere is increasing. The oceans have an enormous capacity for absorbing atmospheric CO2, which is ultimately deposited as calcium carbonate (CaCO3), a mineral that accumulates in sediment (mostly as the shells of molluscs, foraminifera, and other invertebrates). However, the rate of formation of CaCO3 is affected by various factors, including the concentration of inorganic carbon in seawater as well as acidity. This concentration is determined by the rate at which CO2 enters the oceans from the atmosphere, minus its biological uptake (mostly by phytoplankton during photosynthesis). Although anthropogenic CO2eventually ends up as CaCO3 in oceanic sediment, there is a substantial time-lag in the response of oceanic sinks to increasing concentrations of CO2 in the atmosphere. This lag allows atmospheric CO2concentrations to increase because of anthropogenic emissions.
Acidification of the ocean is an additional issue. In actual fact, the ocean is maintained as a non-acidic environment by carbon dynamics and a variety of other influences, with a typical pH between about 7.5 and 8.4 (Chester and Jickells, 2012). In this case, acidification would be represented oceanic water becoming less alkaline over time. The acidification is caused by atmospheric CO2 dissolving into oceanic water, a process that forms carbonic acid (H2CO3), a weak acid, according to this equation:
CO2 + H2O ⇌ H2CO3
The carbonic acid may then dissociate to form bicarbonate (HCO3–) and carbonate ( CO3–2), as follows:
H2CO3 ⇌ HCO3– + H+ ⇌ CO3–2 + H+
The rate at which CO2 can dissolve into the ocean is in equilibrium with its atmospheric concentration. As a result, the rapid increases of atmospheric CO2 (to 400 ppm in 2015) has resulted in more dissolving, more production of carbonic acid, and the apparent beginning of acidification of that vast aquatic ecosystem. One estimate is that the average pH of the global oceans has decreased from 8.25 to about 0.1 unit less (still non-acidic, but nevertheless representing a degree of acidification; Jacobson, 2005). Ocean acidification is a potentially serious problem, because many marine organisms can only live within a narrow range of tolerance of this aspect of water chemistry.
Figure 17.5. Key Compartments and Fluxes of the Global Carbon Cycle. Amounts stored in the compartments are in units of tonnes of carbon, while transfers are in tonnes of carbon per year. Sources: Data from Blasing (1985), Solomon et al. (1985), Schlesinger (1995), and Global Carbon Budget (2014).
Climate Change
As was previously examined, Earth has a naturally occurring greenhouse effect, the physical mechanism of which is relatively simple and understood by scientists (Chapter 4). Moreover, the greenhouse effect helps to maintain the surface temperature within a range that is comfortable for organisms – averaging about 15°C, or 33° warmer than it would be with a non-greenhouse atmosphere. It is also well documented that the concentrations of CO2 and other radiatively active gases are increasing in the atmosphere. It is reasonable, therefore, to hypothesize that this increase will intensify the natural greenhouse effect.
Although this potential intensification of the greenhouse effect remains a hypothesis, it is an extremely important one. If this environmental change does happen, it would have many climatic and ecological consequences, some of which would be catastrophic for both economically important and natural ecosystems.
Climate change refers to long-term variations of the weather that are experiences in a region. One of the most important indicators of climate change is the temperature of the surface atmosphere. Air temperature is measured routinely in many places throughout the world. These data can be used to calculate estimates of the average surface temperature of Earth and to detect changes over time. However, the air-temperature records suffer from some important problems:
- Air temperature is extremely variable over time and space, and the unfavourable signal : noise ratio makes it difficult to detect long-term trends.
- Most of the older data are less reliable than modern records (accurate recordings of surface air temperatures began around 1880).
- Many weather-monitoring stations are located in urbanized areas, and their data are influenced by the so-called “urban heat island”, which is characterized by typically warmer conditions than occurs in surrounding, rural places. Moreover, a large number of initially rural weather stations have become surrounded by urban land-uses, resulting in a “contamination” of their air-temperature records.
- Global temperatures can respond to influences other than changes in the greenhouse effect, such as the cooling effects of volcanic eruptions that inject great masses of highly reflective aerosols into the upper atmosphere, as well as variations in the intensity of solar output.
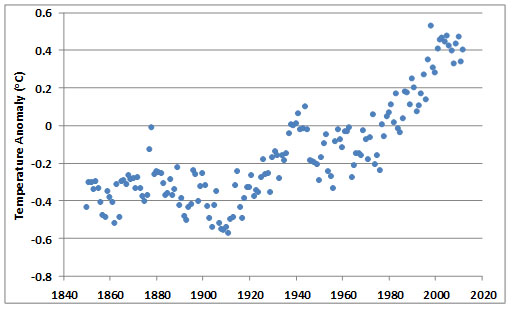
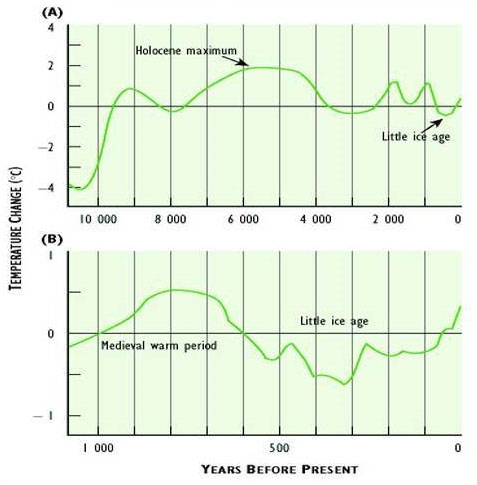
In spite of the various difficulties with data used to estimate Earth’s average surface temperature, recent analyses suggest that there has been a definite warming trend since the mid-nineteenth century. The average global surface temperature has increased by more than 0.8°C over the past 150 years (Figure 17.6). The warmest years since 1850 have all occurred since about 1990. This warming partly reflects the end of a 400-year period of climate cooling, known as the Little Ice Age, which lasted until the mid-1800s (Figure 17.7). However, there appears to have been a particular intensification of warming during the most recent several decades. Note also that the recent warming trend is not without precedent – even warmer periods have occurred during the past 10-12-thousand years.
Figure 17.6. Recent Changes in Global Surface Temperature. The data are the global annual temperature anomaly (°C), calculated relative to the average for 1961-1990. A negative value means a year was relatively cool, while a positive number means it was warmer. Source: Data from Jones et al. (2013).
Figure 17.7. Deviation of Global Average Surface Temperature from Present Conditions. Curve (a) shows long-term trends since the end of the most recent ice age. Curve (b) shows the past millennium. Note that a value of “zero” means that no temperature change (deviation) has occurred. Sources: Modified from Environment Canada (1995).
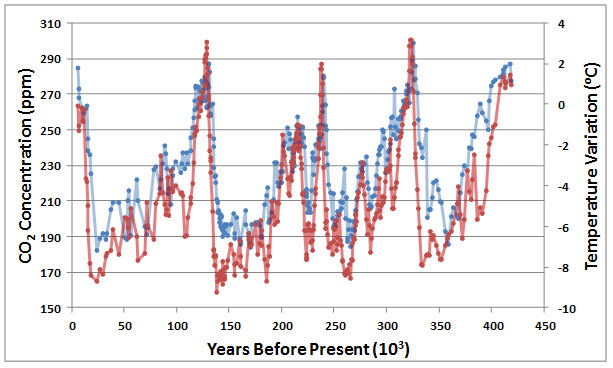
Moreover, paleoclimatic studies of long-term changes have provided rather convincing evidence of a link between concentrations of atmospheric CO2 and climatic warming. Especially valuable data come from a core of glacial ice taken in Antarctica, representing a record of 417-thousand years (Figure 17.8). Results of this important study suggest a strong correlation between CO2 concentration and air temperature, implying a possible causal relationship. It is not clear, however, whether increased concentrations of CO2caused warming via an intensified greenhouse effect, or possibly the opposite. An increase in CO2emissions from ecosystems could have been a result of climatic warming, perhaps because the rate of biomass decomposition increased or because of the warming of frozen soil in polar latitudes (which would release biomass in permafrost for decomposition and methane release). Clearly, Figure 17.8 suggests a strong relationship between CO2 and temperature change, but the possible interpretations are ambiguous because of “chicken or egg” considerations – it is unclear which came first.
Figure 17.8. Variations in Atmospheric CO2 and Surface Temperature. These data were obtained by studying a 417,000-year glacial-core record from Vostok, Antarctica. The red data are the temperature deviation and the blue are CO2 concentration. The two data sets are strongly correlated, with a coefficient of 0.82. Sources: Data from Petit et al. (2000) and Barnola et al. (2003).
Other valuable insights have been obtained by running sophisticated mathematical models of global climate processes on high-powered supercomputers. These “virtual experiments” examine the potential climatic responses to increases in atmospheric CO2. The computer simulations are known as three-dimensional general circulation models (GCMs). The models simulate the complex movements of energy and mass in the global circulation of the atmosphere. They also examine the interactions of these processes with physical variables that are important aspects of climate, such as temperature and precipitation. Many simulation experiments have been run using various GCMs, and the results are variable. Nevertheless, a strong tendency that emerges from these virtual experiments is that global warming and associated climate changes are a likely consequence of the well-documented increases of CO2 and other GHGs in the atmosphere.
Many such simulation experiments have examined the scenario of a doubling of CO2 concentration from its recent concentration of about 400 ppm. These experiments suggest that such a doubling would result in an increase of 1°C to 4°C in the average temperature of the surface atmosphere. The intensity of warming is predicted to be greatest in high-latitude regions, where the temperature increases might be two to three times greater than in the tropics.
Warming of the lower atmosphere will be one likely change that will be caused by an increased intensity of the greenhouse effect. However, there could also be important effects that occur indirectly, in response to changes in the distribution of heat in the atmosphere. The most important of the indirect changes would include large-scale shifts in the patterns of atmospheric circulation. Such shifts would likely result in changes in the amounts, spatial distribution, and seasonality of precipitation. Changes in precipitation regimes would influence soil moisture, which would greatly affect the distribution and productivity of vegetation, both natural and managed. These changes in precipitation regime would likely have much greater effects on agricultural and wild ecosystems than would any direct influence of a warmed atmosphere.
Global Focus 17.1. The 2014 IPCC Report
The Intergovernmental Panel on Climate Change (IPCC) is mandated by the United Nations to review the accumulating body of scientific evidence related to climate change. The IPCC also helps to formulate policies to reduce emissions of greenhouse gases and to deal with the economic and ecological consequences of climate change. The IPCC is considered by many people to offer authoritative evidence and opinions relevant to climate change and its consequences. Still, the field is highly controversial, and some other people believe that some of the work of the IPCC is flawed by political processes and social pressures that are involved in its consensus-building processes.The IPCC has released an influential series of research reports—in 1990, 1995, 2001, 2007, and 2014. Each of the IPCC report was the most detailed syntheses ever done, up to their time. The 2014 IPCC report (IPCC, 2014a). The reports made strong statements about the reality of global warming, its potential consequences, and the anthropogenic role in its causation. Some highlights include the following statements (from IPCC, 2014b; text in italics is directly quoted):
- Human interference with the climate system is occurring, and climate change poses risks for human and natural systems.
- In recent decades, changes in climate have caused impacts on natural and human systems on all continents and across the oceans. The evidence of impacts is strongest for natural systems, but effects on human systems have also been attributed.
- In many regions, changing precipitation or melting snow and ice are altering hydrological systems. This is affecting water resources, with glaciers shrinking almost worldwide, affecting runoff and water resources downstream, and permafrost warming and thawing in both high-latitude and high-elevation regions.
- Many terrestrial, freshwater, and marine species have shifted their geographic ranges, seasonal activities, migration patterns, abundances, and species interactions in response to ongoing climate change.
- Based on many studies covering a wide range of regions and crops, negative impacts of climate change on crop yields have been more common than positive impacts.
- Impacts from recent climate-related extremes, such as heat waves, droughts, floods, cyclones, and wildfires, reveal significant vulnerability and exposure of some ecosystems and many human systems to current climate variability.
- Climate-related hazards exacerbate other stressors, often with negative outcomes for livelihoods, especially for people living in poverty. Poor people are affected by effects on livelihood, reduced crop yields, or destruction of homes, as well as indirectly by increased food prices and insecurity.
The IPCC (2014b) report also noted that society was now routinely incorporating climate-related adaptations into planning and social policies:
- Adaptation is becoming embedded in some planning processes, with more limited implementation of responses. Recognition is increasing of the value of social, institutional, and ecosystem-based measures, and of the limits to adaptation . So far, technological and engineered options are the most commonly implemented adaptive responses, often within existing programs such as disaster risk management and water management.
It must be recognized that these and other IPCC projections and policy suggestions are based on imperfect scientific and economic models. Nevertheless, although the IPCC predictions suffer from some degree of inaccuracy, the likelihood of errors was addressed in the many component studies (and is indicated by qualifiers such as “very likely” and “high confidence”). The field of anthropogenic climate change remains highly controversial, but the IPCC (2014) reports are by far the most reliable sources of credible information that we have to advise our individual and societal responses to this important problem.
Ecological Effects
In terrestrial ecosystems, the direct effects of global warming and associated climatic changes would be restricted mainly to plants. Animals and microorganisms would also be affected, but only through secondary responses to changes in their habitat caused by any effects on vegetation.
The predicted increases in air temperature might not affect plants much because those changes would probably not be sufficient to increase heat-related stress. Much more important would be any substantial changes in the amounts and seasonal patterns of precipitation. Soil moisture is often a key environmental influence on the distribution and productivity of vegetation. For instance, a decrease in the amounts of precipitation or soil moisture in the Canadian Prairies would likely cause the natural mixed-grass prairie to change into short-grass prairie, or even to semi-desert. Decreased soil moisture would also affect the kinds of crops that could be grown in many regions, as well as their productivity. That could make present agricultural systems more difficult or even impossible unless irrigation was practised.
About 14-thousand years ago, the continental glaciers started to melt back, and they were about 80% gone by 8-10-thousand years ago. Vegetation in the regions of Canada changed substantially during the warming climates that followed this deglaciation. One of the paleoecological tools that have been used to study the changes involves the examination of fossil pollen grains extracted from dated sections of cores of lake sediment (these studies are known as palynology). This kind of analysis has provided a record of vegetation changes extending as far back as early deglaciation.
The research in Canada and elsewhere suggests that plants responded to post-glacial warming in a species-specific manner. This occurred because of the different abilities of species to migrate to and colonize newly available habitats released by the melting of glacial ice. As a result, the species composition of early post-glacial plant communities was different from that occurring today under similar climatic regimes. We can expect the responses of natural vegetation to future climate changes to also be species-specific. This will result in the development of plant communities that are different from those that occur now. If climate change results in substantial modifications in the character of plant communities, there will also be adjustments in the species of animals, microbes, and other organisms that can be supported on the landscape. Challenges to native biodiversity will be an important consequence of climate change in Canada and everywhere else in the world.
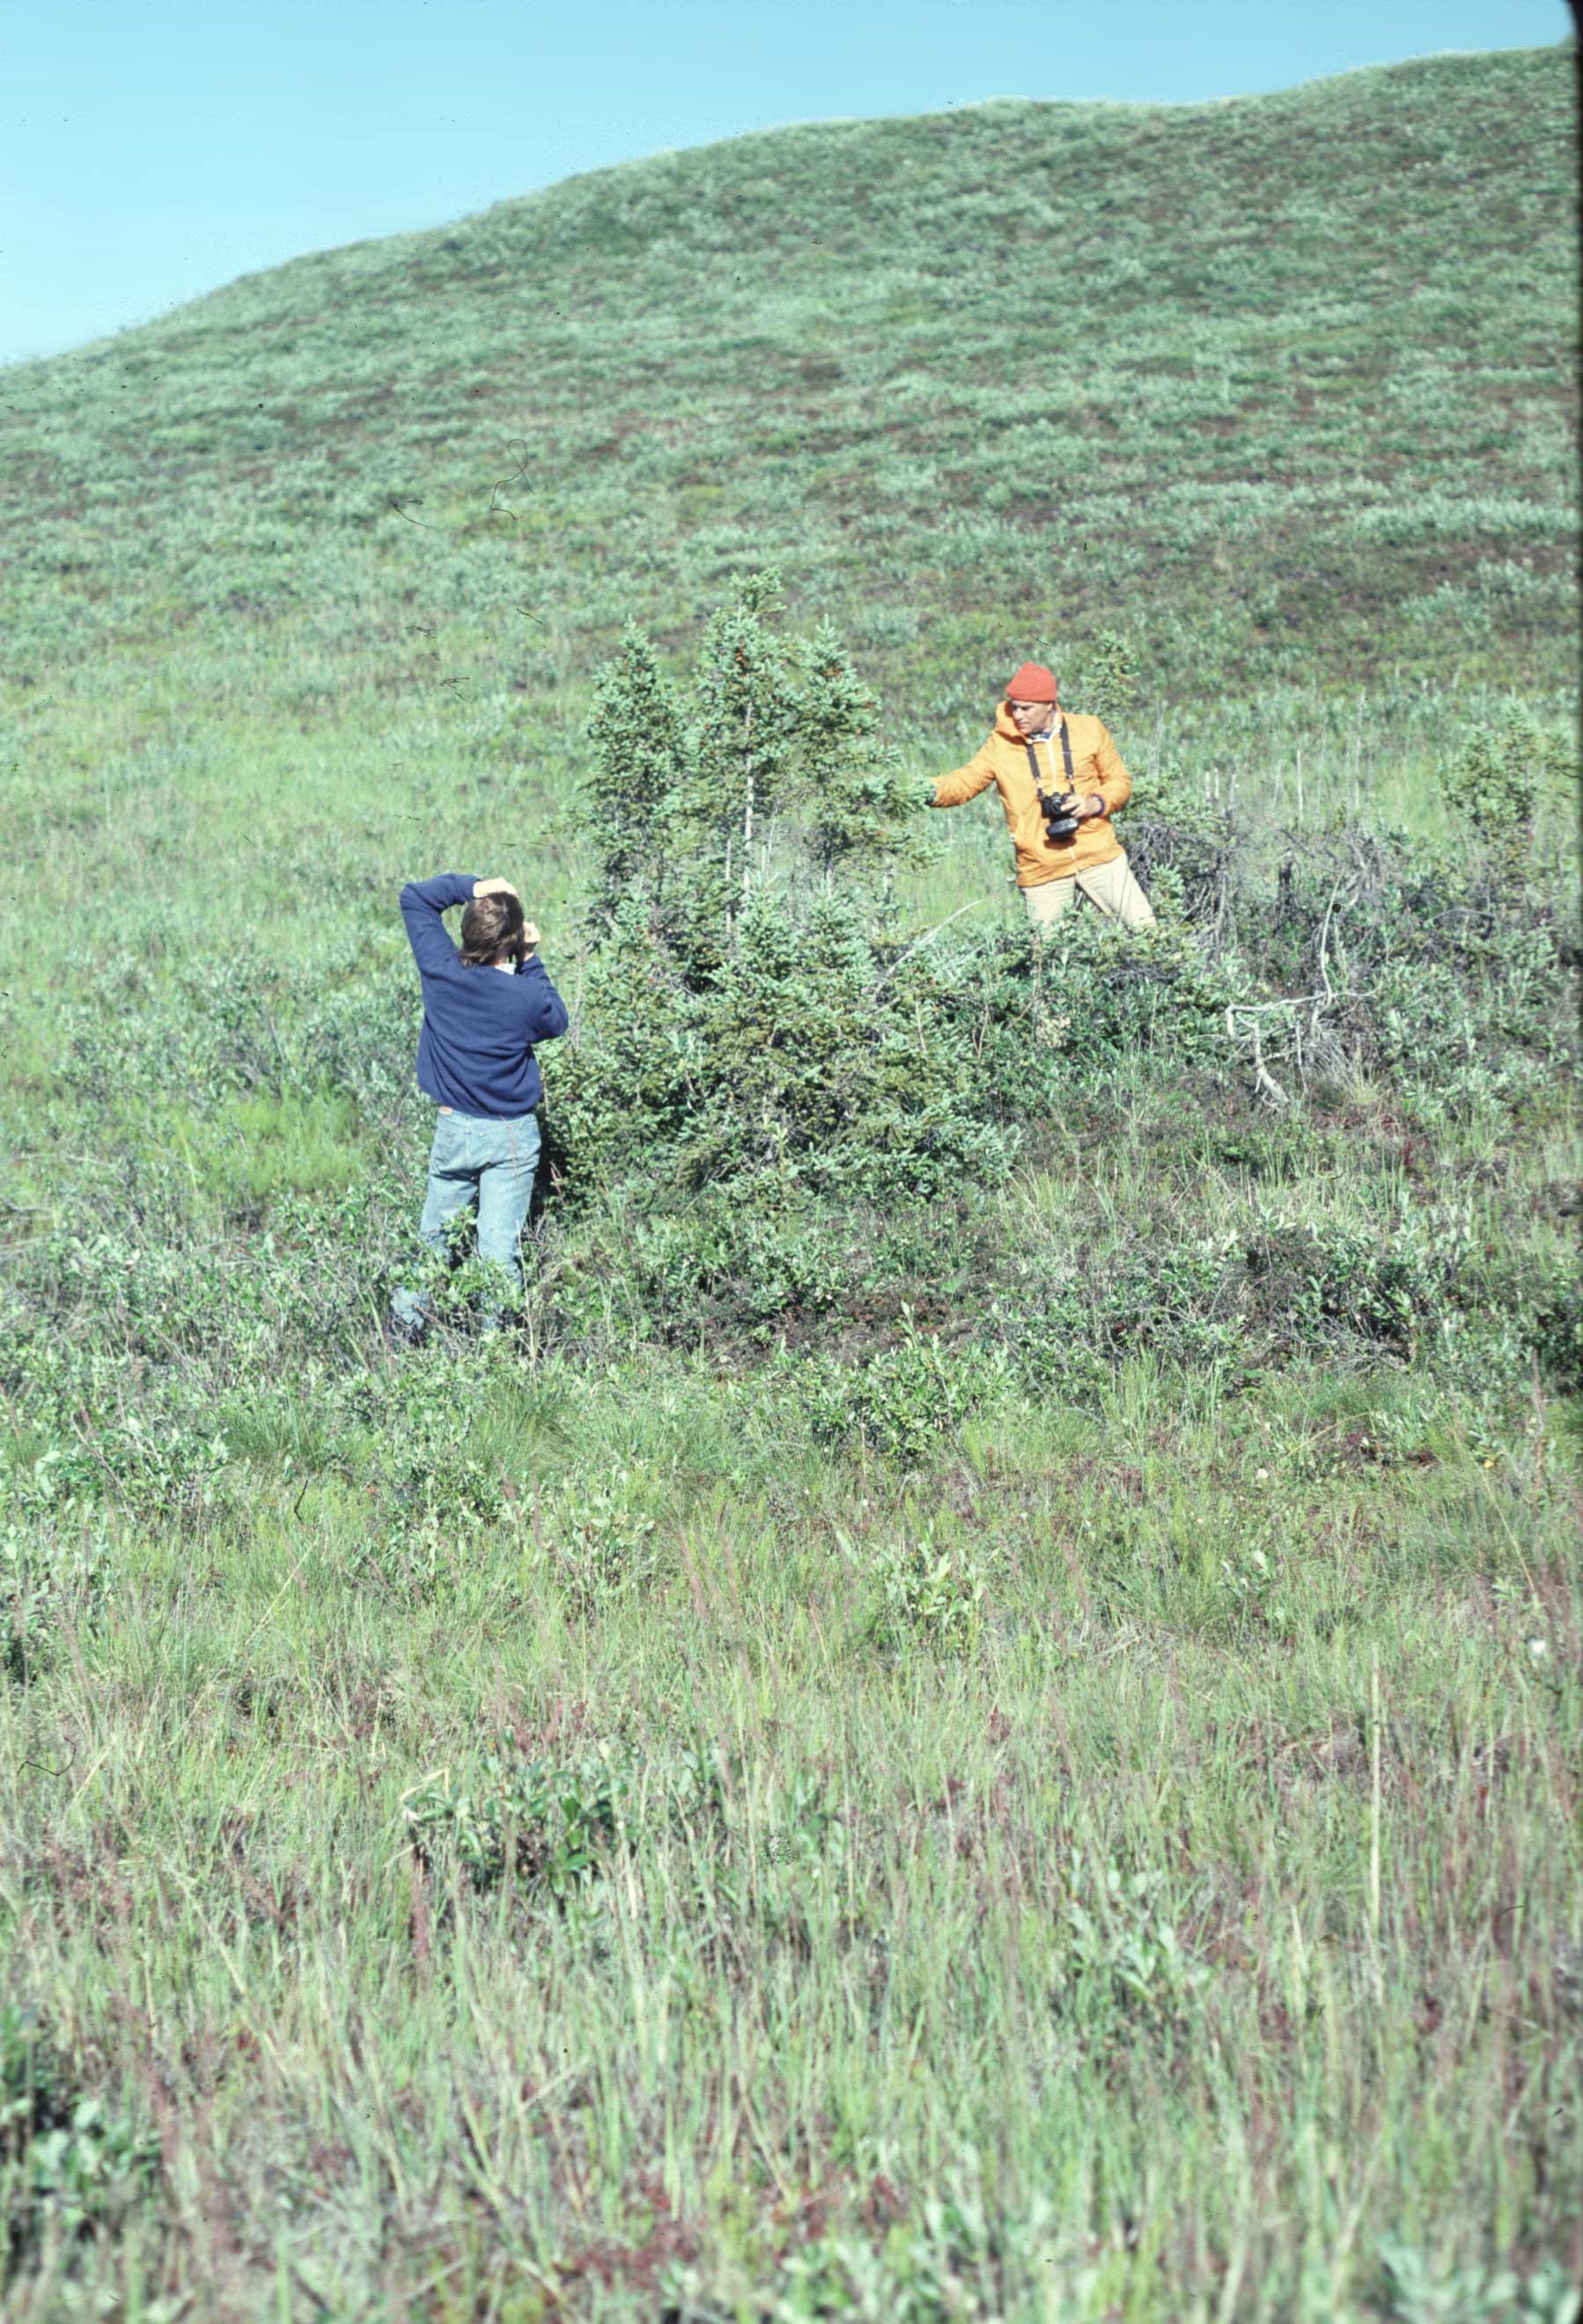
Image 17.3. This is a small “island” of trees in the midst of tundra near Tuktoyaktuk in the Northwest Territories. These short individuals of white spruce (Picea glauca) are remnants of a more widespread population that established during a period of warmer climate more than about six centuries ago. If an anthropogenic intensification of Earth’s greenhouse effect were to result in a warming climate, as has been predicted, then these tree-islands may be focal points from which trees could colonize the tundra. If this kind of change occurs over large area, there would be profound consequences for the biota and for human interests. Source: B. Freedman.
Climate change in tropical countries, which support much larger numbers of species than Canada does, would have great ecological consequences. For example, most of northern and central South America is now characterized by a warm and humid, tropical climate. However, this region is thought to have been considerably drier during the past glacial period, which ended 10-14-thouand years ago. During that time, much of the tropical region was covered by an open-canopied savannah, while rainforest occurred only in isolated regions with relatively high rainfall, known as refugia. In terms of the landscape, the refugia of tropical forest occurred as “islands” within a more extensive matrix of savannah, which is an inhospitable habitat for species of moist forest. The restructuring of tropical ecosystems during the Pleistocene Ice Age, which was driven by climate changes of the time, must have had enormous impacts on the multitudes of rare species of the rainforest. It is likely that many of those species became extinct as a result of the habitat changes. In modern times, an anthropogenic intensification of the greenhouse effect would also cause substantial changes to occur in the character of tropical habitats over enormous areas, and similar ecological calamities would again result.
It is important to acknowledge that scientists do not fully understand the probable dynamics of impending changes in climate. As a result, they are not able to make reliable predictions about the changes in surface temperature, precipitation, evapotranspiration, and other climatic factors that may occur in the regions of Canada or elsewhere. Nevertheless, it can be reasonably suggested that any large changes in climate, and especially in precipitation, would result in fundamental alterations of the structure and productivity of both natural ecosystems and agroecosystems. Those changes would have important consequences for the flows of resources that are required by people, as well as for the habitats of other species.
As was just noted, changes in climate would influence the ability of landscapes to support agricultural production. In Canada, this would be particularly true of the great expanses of agricultural land in the Prairie Provinces. Much of this terrain is already marginal from a rainfall perspective, and is vulnerable to years of severe drought. Wheat, for example, is a vital crop that is grown extensively in areas that were originally short-grass prairie. In North America, as much as 40% of this 400-million hectare, semi-arid region has already been desertified to some degree as a consequence of ecological changes associated with agricultural practices. Sporadic crop-threatening droughts occur widely. If the land is irrigated, the limitations of sparse precipitation in this region can be alleviated. However, insufficient water is available for this purpose, and secondary problems, such as salinization, can be caused by irrigation. Clearly, any further losses of soil moisture in this important agricultural region would be extremely damaging to agricultural production and to food security.
The extent and severity of forest fires would also likely be affected by changes in the amount and distribution of precipitation and evapotranspiration, and to their secondary effects, such as soil moisture. In a typical year, 1-2-million hectares of forest burns in Canada, but this is variable – in some years more than 10-million hectares may be consumed. Modelling experiments have suggested that an increased intensity of the greenhouse effect would cause a drier climate to occur over much of the boreal region, and this could result in a 50% increase in the annual burned area (Flannigan and Van Wagner, 1991).
In marine ecosystems, increases in water temperature would adversely affect some biota. Prolonged warming may cause corals to lose their symbiotic algae (known as zooxanthellae), sometimes resulting in death of the coral. This syndrome of damage, known as coral bleaching, can be induced by unusually high or low temperature, changes in salinity, and other stresses. Coral reefs are the world’s most biodiverse marine ecosystems, and they are already threatened by many stressors associated with human activities, including coastal pollution, mining of the coral, and overly intensive fisheries.
Another predicted consequence of global warming is the accelerated melting and retreat of glaciers. There is widespread evidence that this change is already occurring. In Canada, most glaciers in Alberta, British Columbia, Nunavut, and the Yukon are in rapid retreat. This will have consequences for the flow of rivers that are substantially dependent on glacial meltwater, including large ones that provide water for some of the largest cities and towns in Alberta and Saskatchewan, including Calgary, Edmonton, Regina, and Saskatoon. Rapid glacial retreat is also well documented in the Alps of Europe and on Mount Kilimanjaro in Kenya, the top of which may be ice-free by 2050. It is also affecting the world’s most massive glaciers, in Greenland and Antarctica.
An additional predicted effect of global warming is an increase in sea level. This change would be caused mostly by a thermal expansion of seawater, because as water warms, its volume increases. There would also be an influence on sea level from the melting of massive glaciers, particularly those in Antarctica and Greenland, which would release some of their enormous mass to the oceans. Even an increase of sea level of a metre or so would have massive implications for low-lying populated regions, such as the Netherlands in Europe and the Maldives and other archipelagos in the Indian and Pacific Oceans. These low coastal places would become much more vulnerable to the devastating effects of storm surges. There would also be risks for shallow-water marine ecosystems, such as coral reefs.
It is also predicted that global warming might increase the frequency, and perhaps the severity, of events of severe weather. This means that hurricanes, tornadoes, and even El Niño events could become more frequent, and perhaps also more intense. These extremes of weather have well known, devastating effects on economic and ecological systems. Most of the climate-modelling studies suggest that the intensity of warming will be much greater at higher latitudes. This means that changes in countries like Canada, where the climate ranges from temperate to polar, would be much greater than in tropical regions. Therefore, relatively wealthy, well-developed countries like Canada and the United States may be exposed to much of the damage associated with climate change. Less-developed, equatorial countries may be less directly affected. These predictions are, however, highly uncertain.
Global Focus 17.2. The Kyoto Protocol
Scientists agree that the Earth has a naturally occurring greenhouse effect that helps to keep the planet habitable. They also agree that this key function is due to greenhouse gases (GHGs) in the atmosphere, whose concentrations are increasing rapidly, particularly carbon dioxide. Although there is some controversy as to whether the increased GHGs will intensify the greenhouse effect, scientists are rapidly moving toward a broad consensus that considerable warming is likely to occur. Because global warming would have great consequences for the human economy and the natural world, mitigative actions are being proposed, and in some cases taken, by governments.On the international front, key initiatives related to research and planning are being led by the United Nations Environment Programme (UNEP) and the World Meteorological Organization (WMO), which in 1988 established the Intergovernmental Panel on Climate Change (IPCC). The IPCC undertakes comprehensive reviews of the science of global warming, with a focus on likely scenarios of climatic, ecological, and economic consequences. The IPCC also does research on ways to slow or prevent the increases in GHGs and on how economic and ecological systems might adapt to predicted climate change. At the international level, the IPCC is the most credible source of information about climate change. In 2014, the IPCC released its fifth round of technical and policy reports (IPCC, 2014a).
Because of concerns about the potentially disastrous consequences of global warming, in 1990 the IPCC and other groups of climate specialists recommended that the United Nations (UN) mobilize global leadership to negotiate an international agreement to reduce emissions of GHGs. The UN then established an Intergovernmental Negotiating Committee to draft the terms of a UN Framework Convention on Climate Change (UNFCCC). After a series of difficult international negotiations, the UNFCCC was drafted and then adopted in 1992 at the UN Conference on Environment and Development (UNCED) held in Rio de Janeiro, Brazil.
The objective of the UNFCCC is to stabilize atmospheric GHGs at concentrations that would prevent a dangerous intensification of the planetary greenhouse effect. Signatory nations to the UNFCCC, known as “parties to the convention,” have agreed to undertake certain actions to compile information on emissions of GHGs, develop policies to decrease emissions, prepare strategies to adapt to anticipated effects of climate change, and provide financial and scientific support to developing countries. Moreover, the 140 countries that signed the UNFCCC in Rio agreed to discuss its implementation at a global forum, which was held in Berlin in 1995. At that meeting, it was agreed that global emissions of GHGs should be reduced and a further series of international negotiations was needed to reach consensus on an implementation strategy. Those negotiations were completed at another meeting, held in Kyoto, Japan, in 1997. The outcome of that key meeting was the Kyoto Protocol.
According to the terms of the Kyoto Protocol, the world’s nations are divided into three groups:
- Annex I consists of developed and rapidly developing countries, including the United States, Canada, those of the European Union, Japan, Russia, and Australia. It also includes rapidly developing countries that are major emitters of GHGs, such as China and India, but these were excluded from the CO2-reduction obligations of the wealthier countries.
- Annex II consists of the same developed countries as in Annex I (38 countries), but not the rapidly developing ones (also known as economies in transition). The Annex II countries have special obligations to reduce their emissions (overall by 5.2% compared with 1990 levels), and they must also help developing countries by providing financial and technological resources to reduce emissions and adapt to any adverse effects of climate change.
- Annex III consists of the world’s least-developed countries – these have ratified the Kyoto Protocol but have no immediate obligations to reduce their emissions of GHGs.
In addition, many organizations have “observer” status, including about 50 inter-governmental and 650 non-governmental organizations (NGOs) that represent the business, environment interests, industry, labour, indigenous cultures, and research and academic bodies. For the Kyoto Protocol to become legally binding, it had to be ratified by at least 55 parties to the UNFCCC, including enough Annex I countries to account for at least 55% of the CO2 emissions of all developed countries (in 1990). Canada, the European Union, and Japan ratified in 2002, and when Russia did so in 2004, the 55% criterion was reached and the Kyoto Protocol because a legal treaty. Unfortunately, the United States had not ratified the Protocol, although it is nevertheless making progress with actions to reduce its emissions of GHGs.
Key aspects of the Kyoto Protocol are the binding targets that it sets for the reduction of GHG emissions by developed countries. It is important to understand, however, that the Protocol is only a first step toward reducing global emissions of GHGs – the intent is to negotiate additional protocols that will include reductions by rapidly developing countries such as China and India, and further efforts by developed ones. For example, in 2015, the global community met in Paris to review and improve upon the existing Kyoto-related targets to reduce emissions of GHGs.
The commitments of Canada are typical of countries of Annex II. When Canada ratified in 2002, it committed to reduce its emissions of CO2 by 6% below the levels in 1990, and to achieve that goal by 2008-2012. To accomplish such a large reduction was, however, a formidable challenge. In fact, by the target date, Canadian emissions of CO2 had increased by about 33% since 1990. That had occurred mostly because of rapid economic developments in Alberta, especially great increases in the amount of mining and processing of oil-sand. Moreover, even today, Canada has not developed an effective strategy for meeting its legal obligations under the Protocol, largely because of the intense political and economic controversies associated with the actions that would be necessary. Moreover, the governments of Canada and some other jurisdictions, notably Alberta, are focusing on intensity-based targets, which encourage improved technological efficiencies but do not necessarily reduce the aggregate emissions of GHGs. Such tactics do little to reduce the rapid increase of emissions from new fossil-fuel enterprises, such as the aggressively growing oil-sand industry.
In 2012, Canada formally withdrew from its ratification of the Kyoto Protocol. This was done by the Harper Government of the day because of the certainty that Canada would badly miss its Kyoto targets, coupled with a political philosophy that economic growth should not be sacrificed to meet environmental targets of this sort.
At about the same time, the Harper Government announced its new target to reduce emissions of greenhouse gases – to have emissions in 2020 that would be 17% below those in 2005. At the time of this writing, the most recent emissions data (for 2010) showed that our national emissions had actually increased by 13% (Boden et al., 2014). The most important reason for that increase was a rapid expansion in large industrial facilities to mine and process oil-sand in northern Alberta, a development for which much further aggressive growth is planned for the next decade or more. As a consequence, it is extremely unlikely that Canada`s presently avowed emissions reductions will be met.
However, many other developed countries will have little difficulty in meeting their obligations. For instance, since 1990, many countries of Western Europe have extensively replaced coal-burning industrial utilities with ones that use natural gas, which results in a large reduction of CO2 emissions. Also, most countries of the former Soviet Union, including Russia, have suffered a downsizing of their industrial sectors since 1990, making it easy for them to meet their Kyoto targets. These economic restructurings, which had no direct linkage to the Kyoto Protocol, did not occur in North America. The only ways for countries like Canada and the United States to reduce their emissions of GHGs is to rapidly change the ways that energy is used by aggressively enacting conservation measures while also moving away from a heavy reliance on fossil fuels. It will take a high level of political fortitude if they are to achieve such changes, and without such determination, countries like Canada will fail to meet their international obligations to collaborate with other countries in reducing global emissions of CO2 and other greenhouse gases.
Effects of CO2 on Plants
Carbon dioxide is an important nutrient for plants. As a result, increased concentrations of CO2 can stimulate the productivity of some plants, especially if moisture and nutrients are abundant.
Many laboratory experiments have shown that agricultural plants can be more productive when fertilized by CO2. In fact, some commercial greenhouses increase the productivity of crops such as cucumber, tomato, and ornamental plants by fertilizing the air with CO2 at concentrations of 600-2000 ppm.
Usually, however, the productivity of crops grown under field conditions is limited by an inadequate supply of nutrients other than CO2, usually nitrogen, phosphorus, or potassium, and often the availability of water is also a constraint. Under these kinds of conditions, the responses of plants to CO2 fertilization are small and short term, or non-existent.
Increased concentrations of CO2 can also affect many plants by decreasing their rate of water loss by transpiration. Most water loss occurs through tiny pores, known as stomata, on the leaf surfaces. The size of the stomatal opening is controlled by specialized guard cells. Activity of the guard cells is influenced by CO2, and stomata tend to close partially or entirely when its concentrations are high. Because the availability of moisture is an important factor affecting plant productivity in agricultural and forest ecosystems, decreased water losses from lessened transpiration could be a beneficial effect.
It appears that some benefits might be realized from CO2 fertilization and decreased transpiration, especially in intensively managed agricultural systems. It is important to recognize, however, that these gains are likely to be minor. Moreover, the possible benefits would probably be overwhelmed by the negative consequences of anthropogenic climate change. The distribution and composition of natural and managed ecosystems could be greatly affected by effects on precipitation and other climatic factors, and that could result in enormous damage being caused to economic resources in agriculture, forestry, and fisheries, and also to natural biodiversity.
Environmental Issues 17.1. Carbon Credits
Carbon credits (or carbon offsets) are a way to achieve a net reduction of emissions of greenhouse gases (GHGs). For example, a person might want to offset emissions of CO2 associated with the driving a gasoline-powered vehicle. To do this, CO2 credits might be purchased from an organization that commits to plant trees to fix an offsetting amount of atmospheric CO2 into biomass. In essence, carbon credits gained from one activity (such as planting trees) are traded against another that emits greenhouse gases (such as driving a car).Carbon credits are related to systems of emissions trading, which were first applied to releases of SO2. For instance, in the United States, governmental regulators assigned companies an amount of SO2 that they were permitted to emit. If a company exceeded its limit, it could be fined, which provided an economic incentive to meet its target. Alternatively, a company could purchase unused credits from another company that had not reached its SO2 limit. In effect, this system established a “marketplace” for SO2-emission credits.
Although the trading of carbon credits is not yet regulated or certified in Canada, they are still being acquired by many individuals and companies who are seeking to reduce their net emissions of GHGs or to achieve a carbon-neutral lifestyle or business. Carbon credits can be generated in various ways:
- Afforestation is the establishment of forest on land in a low-carbon area, such as pasture or cropland. As the forest grows, the carbon stored on the land increases, resulting in less CO2 in the atmosphere, plus additional benefits such as habitat for biodiversity. If the intent of a project is to develop an older forest and maintain it, then the carbon-storage benefits are larger than any other ecological offset scheme.
- Reforestation is the regeneration of a new forest on land where timber has been harvested. Although the harvest reduces the carbon stored on the site, reforestation ensures that forest biomass is regenerated. Compared with a post-harvest conversion of the land to agricultural or urbanized uses, reforestation provides carbon credits.
- Conservation agriculture involves practices that increase soil biomass. This is done by leaving crop residues to enhance soil organic matter, by planting seeds directly into the soil without ploughing, and by using a crop rotation instead of continuously planting a single species.
- Geological carbon storage involves trapping CO2 produced by fossil-fuel combustion and then concentrating it as a liquid or gas that can be injected into an underground reservoir. For instance, CO2 produced by a coal-fired power plant in North Dakota is being concentrated, transported by pipeline to Weyburn in southern Saskatchewan, and injected into a geological formation to enhance pressure and petroleum recovery. Carbon offsets are also generated – up to 40-million tonnes of CO2 over 30 years.
- Replacing some fossil fuel use by non-GHG energy sources also generates carbon credits. This could involve renewable energy sources or nuclear-derived electricity. For example, an investment in the development of wind-turbine energy, photovoltaics, passive solar, or biomass fuels result in less use of fossil fuels. So does improved insulation and wind-proofing of buildings and the installation of higher-efficiency technologies, such as fluorescent lighting and hybrid gasoline-electric vehicles.
It is clear that any of these options results in a reduced amount of CO2 in the atmosphere. Nevertheless, some kinds of carbon credits are controversial, and critics refer to them as “hot air.” Here are the key objections to trading in carbon credits:
- Genuine decreases in CO2 emissions may be avoided by the purchase of carbon credits. Ultimately, dealing with climate change will require that large reductions occur in the emissions of GHGs. In this context, carbon credits may be viewed as a modern form of the archaic Catholic tradition of “indulgences”, or the forgiveness of sins, the purchase of which allowed people to sin without great consequence.
- Fictitious carbon credits have been marketed by disreputable people or organizations, Examples include trees not being planted as contracted or not being tended, so they did not survive. Because carbon trading is not yet regulated or audited, there is potential for fraudulent or incompetent schemes.
- Downsized economies also represent a carbon credit, in that less industrial activity results in reduced emissions of GHGs. Examples include the down-sized economies of post-1990 Russia and other countries of Eastern Europe. These post-Cold War economies became smaller because of inefficiencies of their social and industrial systems, which had nothing to do with actions to reduce emissions of GHGs. It is not sensible to reward a necessary economic restructuring with carbon-credit monies.
- Ecological carbon credits must be maintained against natural disturbances, timber harvesting, and other influences that would reduce the carbon stored in biomass. Moreover, older forests do not forever increase in biomass. Once the maximum is reached, management should maintain the accumulated carbon or convert some of it into “enduring consumer products” such as the wood of buildings or furniture.
Clearly, there are a number of ways to generate reliable carbon offsets, and their implementation will reduce the net emissions of GHGs. However, it is important that these schemes be properly audited and regulated. It is also crucial to understand that any effective, societal-level plan to deal with emissions of GHGs will require large reductions in the use of fossil fuels.
Reducing Carbon Dioxide
Because of the potential consequences of anthropogenic climate change, governments are considering actions to reduce the emissions of CO2 and other GHGs in the atmosphere, or at least to slow their rates of increase. This goal could be achieved in two ways: (1) by reducing the emissions of GHGs, and (2) by increasing the rates at which they are removed from the atmosphere. The latter tactic is especially relevant to CO2, the most abundant of the anthropogenic GHGs.
Ultimately, large decreases in the emissions of GHGs, particularly CO2, must be the major tactic of any strategy to deal with an intensification of the greenhouse effect. However, it is extremely difficult to rapidly reduce emissions of CO2 because they are associated with so many economically important activities. As we previously examined, the major CO2-emitting activities include the use of fossil fuels in industry, transportation, and space heating; the manufacturing of cement; and ecological conversions, particularly of forest to agriculture. Politicians, economists, and environmental specialists all worry about the shorter-term economic consequences of actions necessary to rapidly reduce the emissions of CO2 to the atmosphere. In general, they believe it is more prudent to reduce those emissions through more protracted actions.
Planting large numbers of trees is an option that would contribute to reducing the CO2 concentration in the atmosphere. As trees and other plants grow, they fix CO2 into the organic carbon of their accumulating biomass. Depending on the species and growing conditions, that biomass can eventually reach several tonnes of dry weight per large tree, about half of which is carbon.
Studies have shown that substantial carbon credits can be gained by planting large numbers of trees in urban and rural environments. The carbon credits are especially large if the tree-planting involves afforestation, or the creation of forest on disused agricultural land. (Afforestation converts non-forested land into a forest, while reforestation ensures that another forest regrows on a site from which timber was harvested.) Agroecosystems typically store small amounts of carbon in biomass, while forests store much more. The carbon-storage function would be optimized if mature or old-growth forest is established, and if that ecosystem were maintained in its high-carbon condition for as long as possible. (Harvesting of mature trees would detract from the carbon-storage function.) Moreover, the afforestation of extensive areas would achieve many additional, non-carbon benefits, such as the enhancement of biodiversity.
Although tree-planting and afforestation are attractive options toward reducing CO2 in the atmosphere, these tactics cannot offset more than a portion of the CO2 emitted by fossil-fuel combustion and deforestation. An enormous area of land would have to be afforested to achieve full offsets. For example, to fully offset the CO2 emissions from one 200 MW coal-fired generating station (which would emit about 0.34-million tonnes of CO2-C per year), the carbon-fixing services of about 500,000 ha of natural forest of the kind typical of eastern Canada would be required. If the forest productivity were increased by silvicultural management on a fertile site, as little as one-tenth of that area might be required, but that would still be a huge area (Freedman et al., 1992). Only a limited amount of land is available, in Canada or elsewhere, for afforestation to provide carbon offsets. The use of larger areas would withdraw too much land from other productive uses, especially agriculture.
In any event, dealing effectively with an anthropogenic climate change will require a comprehensive, integrated strategy, of which reduced emissions of GHGs must be the major component. Carbon offsets such as tree-planting will be a useful element, but they will not be sufficient.
The most important means of reducing CO2 emissions would potentially involve the following:
- aggressive conservation of energy through more efficient use, which would result in a decreased demand for fossil fuels
- increased use of non-carbon energy (such as solar, wind, tidal, hydro, biomass, and nuclear) to displace many uses of fossil fuels
- prevention of further conversions of forest into agricultural and other land-uses, to avoid CO2emissions that are associated with deforestation
- afforestation, which would increase carbon stored in ecosystems
However, it must be recognized that the implementation of an effective strategy involving these actions would be politically and economically difficult. Industrialized nations depend heavily on fossil fuels, and changes in this reliance will have huge implications for economic systems, industrial capitalization, resource use, and citizens’ expectations of lifestyle. Similarly, deforestation in tropical countries is a primary means by which impoverished people gain access to opportunities and livelihoods, and harvested timber helps to earn the foreign exchange that is necessary to fund development activities.
The societal changes that would be necessary to effectively deal with an intensified greenhouse effect are revolutionary in their nature and magnitude. Designing the required economic and energy systems will be a tremendous challenge, and implementing them will require enlightened and forceful leadership. Unfortunately, there are no easy solutions to an environmental problem as potentially damaging as anthropogenic climate change. Moreover, it appears that it will be necessary and precautionary to implement effective actions as soon as possible, even before it is definitely known that many of the damages are occurring.
Environmental Issues 17.2. Politics and Climate Change
It is reasonable to conclude that not much of the scientific debate about climate change is actually about whether the climate is changing! In fact, there is a broad consensus among scientists that global climates have always changed, that this is also occurring now, and there has been a substantial warming since about 1850 when the Little Ice Age ended. Rather, the ongoing dispute is about the role of human influences on the recent trend of global warming – whether the recent changes in climate are anthropogenic. Although a robust consensus of scientists has concluded that anthropogenic climate change is a clear and present reality, as witnessed by the increasingly strong statements of the IPCC and related organizations, there is still a dissenting minority.In general, the climate-change skeptics do acknowledge that there has been a recent trend of global warming, because it is well evidenced by melting glaciers, a lengthening ice-free period in polar waters, climate-related changes of the distribution of many species, and an increase in mean global surface temperature. Nevertheless, the skeptics believe that natural causes may be responsible for these effects – such as variations in the emission of energy by the Sun or in the absorptive capacity of Earth’s atmosphere (perhaps related to changes in reflective aerosols emitted by volcanoes).
Because there is not yet scientific unanimity about anthropogenic climate warming, there is room for political and economic interests to deny that the problem is real or important. This allows them to avoid taking expensive actions to mitigate the problem, such as reducing the emissions of greenhouse gases. To further build their dissenting case, vested economic interests (such as companies in the fossil-fuel sector) may provide funding to climate-change skeptics or their organizations to help marshal dissenting evidence and engage in the public debate. Furthermore, climate-change skeptics often give prominence to environmental research that runs contrary to mainstream observations of climate warming, such as expanding glaciers in a particular area, which are exceptions to the much more frequent observations of mountain glaciers and polar ice that are retreating at rates unprecedented in recorded history.
Arguably, these are legitimate actions for the vested interests to take, because effective societal responses to anthropogenic climate change have such large economic implications. Nevertheless, it is possible to view such actions with a cynical eye, because these kinds of tactics have been used before with other public controversies related to health and environment, such as thalidomide, cigarette smoking, acid rain, and others. In fact, some environmental advocates suggest that it is possible to establish a predictable framework for the response of vested industrial / economic / political interests to public controversies, such as anthropogenic climate change:
- Step 1. Deny that the problem exists, or claim that the scientific evidence is weak or inconsistent.
- Step 2. If possible, suppress the conduct or release of new scientific research that is likely to produce results that are contrary to the views of the vested interest. This is possible if scientific agencies are under their political or economic control.
- Step 3. If possible, blame “external” influences or interests for the damage, particularly “natural” factors.
- Step 4. Insist that an especially large burden of well-validated scientific evidence must be in place before agreeing that environmental change has been substantial enough for the vested interest to accept a measure of responsibility and so to take mitigative action.
- Step 5. Finally, claim that despite any resulting environmental damage, the instigating economic activity is too important to the regional/national/global economy to bear significant regulation – in the sense that any slowing of economic activity is viewed as being contrary to vital national interests and therefore unacceptable to society at large.
However, there are also cases where people and organizations that believe in anthropogenic climate change have mocked or denigrated the views of skeptics. Moreover, some climate-change proponents “oversell” some of the evidence. For example, some proponents claim that hurricane Katrina (2005) and similar events of extreme weather were somehow caused by global warming. In fact, this is just an idea and there is no convincing scientific evidence to back it up (although modelling research does suggest that over the medium- and longer-term, the Gulf of Mexico and other tropical waters will become warmer and this might be expected to spawn more and stronger hurricanes). These non-objective positions are particularly worrisome if scientists are involved, because the conduct and communication of their knowledge should remain objective and apolitical and not stray into the emotional realm of advocacy.
Moreover, environmental scientists have a limited ability to provide convincing evidence of an anthropogenic influence. Climatic systems are extremely large, open, and complex, and science is not able to make watertight predictions about these sorts of systems. In fact, uncertainty about outcomes is the basis of a precautionary orientation: scientists may advocate action in the absence of complete proof, because the consequences of no action might be too great for society to absorb. This is the reason why so many scientists are advocates of taking action to deal with climate change, even though they may not yet be fully convinced, in a strictly scientific sense, of the degree to which recent global warming is due to anthropogenic influences.
Strident advocacy positions by either skeptics or believers of anthropogenic climate change are not particularly helpful. Ideally, environmental controversies should be resolved by a continuous and objective review of the emerging scientific evidence, and by a consensual development of political and economic policies that would effectively mitigate the problem.
Conclusions
Earth’s natural greenhouse effect is caused by the activity of radiatively active gases in the atmosphere, and it helps make the planet habitable. The concentrations of key GHGs are increasing rapidly, particularly carbon dioxide, and this is predicted to intensify the greenhouse effect. This could result in global warming and many other climatic effects, such as changes in precipitation regimes and in the frequency of severe weather events. These changes would have severe consequences for agroecosystems and the human economy in general, and also for natural ecosystems (notwithstanding that, in some places, there might be improvements in agriculture and new opportunities for some species and ecological communities). At the international level, the Kyoto Protocol is the key first action being taken to reduce the emissions of GHGs that threaten to cause global warming. Many countries have ratified this treaty and are taking steps to reduce their emissions of GHGs (unfortunately, Canada withdrew its ratification in 2012 because of an imminent failure to meet its targets for reduced emissions). However, the Kyoto-related actions are highly controversial and are not in themselves sufficient to achieve their intended goal of preventing or slowing global warming – future actions will have to be more decisive.
Questions for Review
- Describe Earth’s natural greenhouse effect and the factors that create it.
- How may human influences be making the greenhouse effect more intense?
- What is a greenhouse gas (GHG)? What are the most important GHGs in the atmosphere, and how are human actions affecting their concentrations?
- What are the likely climatic and ecological consequences of an intensification of the greenhouse effect?
Questions for Discussion
- How might the Canadian economy and the lifestyles of typical Canadians be affected if serious actions are taken to reduce the emissions of greenhouse gases?
- Despite repeated commitments since the Conservative Party of Canada assumed control of the Government of Canada, our country has not yet announced a comprehensive strategy to reduce our national emissions of greenhouse gases. Especially problematic are a lack of regulations for the fossil-fuel industries, whose rising emissions are the key reason that Canada has missed its avowed Kyoto targets. Do you think that these actions by the Harper Government are prudent and justified, or do you disagree with them? Explain your answer.
- Mostly because of the potential economic effects, the Kyoto Protocol has been highly controversial in Canada and other countries. But even if the provisions of the treaty are fully implemented, there would only be a slowing of the rate of increase of greenhouse gas concentrations in the atmosphere. This is because the rates of emission of CO2 and other GHGs would still be larger than can be absorbed by the planetary sinks. Should the reductions of emissions of GHGs be even larger than required by the Kyoto Protocol? How would you convince politicians, industrial interests, and other concerned parties that it must be done?
Exploring Issues
- Your provincial government has struck a committee of politicians and citizens to recommend actions to reduce the net emissions of greenhouse gases. As the principal science advisor to the committee, you have been asked to develop a list of practical options that should be undertaken. What actions would you recommend for implementation immediately, and which more gradually (that is, progressively during the next 10 years)? Justify each of your recommendations.
- For one day, make a list of your activities that result in emissions of carbon dioxide or methane to the atmosphere. These should include direct emissions (for example, by breathing or driving a vehicle) and indirect ones (as when trees must be harvested to provide you with paper, or when organic garbage is disposed into a landfill). Estimate the percentage reduction in emissions that you think you could make without suffering an unacceptable degree of change in your lifestyle.
References Cited and Further Reading
Archer, D. 2011. Global Warming: Understanding the Forecast. J. Wiley & Sons, New York, NY.
Archer, D. and S. Rahmstorf. 2010. The Climate Crisis: An Introductory Guide to Climate Change. Cambridge University Press, Cambridge, UK.
Barnola, J.M., D. Raynaud, Y.K. Korotkevich, and C. Lorius. 1987. Vostok ice core provides 160,000-year record of atmospheric CO2. Nature, 329: 408-414.
Barnola, J.-M., D. Raynaud, C. Lorius, and N.I. Barkov. 2003. Historical CO2 record from the Vostok ice core. In Trends: A Compendium of Data on Global Change. Carbon Dioxide Information Analysis Center, Oak Ridge National Laboratory, U.S. Department of Energy, Oak Ridge, TN. https://web.archive.org/web/20180104225202/http://cdiac.ess-dive.lbl.gov/trends/co2/vostok.html
Blasing, T.J. 2014. Recent Greenhouse Gas Concentrations. Carbon Dioxide Information and Analysis Center, Oak Ridges, TN. http://dx.doi.org/10.3334/CDIAC/atg.032
Blasing, T.J. 1985. Background: Carbon Cycle, Climate, and Vegetation Responses. Pp. 9-22 in: Characterization of Information Requirements for Studies of CO2 Effects: Water Resources, Agriculture, Fisheries, Forests, and Human Health. DOE/ER-0236, U.S. Department of Energy, Washington, DC.
Boden, T.A., G. Marland, and R.J. Andres. 2013. Global, Regional, and National Fossil-Fuel CO2Emissions. Carbon Dioxide Information Analysis Center, Oak Ridge National Laboratory, U.S. Department of Energy, Oak Ridge, TN. http://dx.doi.org/10.3334/CDIAC/00001_V2013
Bolin, B., B.R. Doos, J. Jager, and R.A. Warrick. 1986. The Greenhouse Effect, Climatic Change, and Ecosystems. SCOPE Rep. 29, Wiley & Sons, Chichester, UK.
Brasseur, G.P., R.G. Prinn, and A.A.P. Pszenny (eds.). 2003. Atmospheric Chemistry in a Changing World. Springer, Berlin.
Bryant, E.A. 1997. Climate Process and Change. Cambridge University Press, Cambridge, UK. Carbon Dioxide Information Analysis Centre (CDIAC). 2015. Trends. A Compendium of Data on Global Change. CDIAC, Oak Ridge, TN. https://web.archive.org/web/20170207001555/http://cdiac.ornl.gov/
Chester, R. and T. Jickells. 2012. Marine Geochemistry. Blackwell Publishing, London, UK. Dale, V.H., R.A. Houghton, and C.A.S. Hall. 1991. Estimating the effects of land-use change on global atmospheric CO2 concentrations. Canadian Journal of Forest Research, 21: 87-90.
Detwiler, R.P. and C.A.S. Hall. 1988. Tropical forests and the global carbon cycle. Science, 239: 42-47.
Environment Canada. 1995. The State of Canada’s Climate: Monitoring Variability and Change. SOE Rep. No. 95-1, Environment Canada, Ottawa, ON.
Fletcher, C. 2013. Climate Change: What the Science Tells Us. J. Wiley & Sons, New York, NY.
Flanigan, M.D. and C.E. Van Wagner. 1991. Climate change and wildfire in Canada. Canadian Journal of Forest Research, 21: 66-72.
Freedman, B. 1995. Environmental Ecology. 2nd ed. Academic Press, San Diego, CA.
Freedman, B. and T. Keith. 1996. Planting trees for carbon credits: A discussion of context, issues, feasibility, and environmental benefits, with particular attention to Canada. Environmental Reviews, 4: 100-111.
Freedman, B., F. Meth, and C. Hickman. 1992. Temperate forest as a carbon-storage reservoir for carbon dioxide emitted by coal-fired generating stations: A case study for New Brunswick, Canada. Forest Ecology & Management, 15: 103-127.
Freedman, B., G. Stinson, and P. Lacoul. 2009. Carbon credits and the conservation of natural areas. Environmental Reviews, 17: 1-19.
Gates, D.M. 1985. Energy and Ecology. Sinauer, New York, NY.
Global Carbon Budget. 2014. Carbon Budget 2014. Carbon Dioxide Information Analysis Center, Oak Ridge National Laboratory, U.S. Department of Energy, Oak Ridge, TN. http://www.globalcarbonproject.org/carbonbudget/
Hardy, J.T. 2003. Climate Change: Causes, Effects, and Solutions. Wiley, Hoboken, NJ.
Houghton, J.T. 2004. Global Warming. The Complete Briefing, 3rd ed. Cambridge University Press, Cambridge, UK.
Houghton, R.A. 2008. Carbon Flux to the Atmosphere from Land-Use Changes: 1850-2005. Carbon Dioxide Information Analysis Center, Oak Ridge National Laboratory, Oak Ridge, TN. https://web.archive.org/web/20180104225149/http://cdiac.ess-dive.lbl.gov/trends/landuse/houghton/houghton.html
Houghton, R.A., J.E. Hobbie, J.M. Melillo, B. Moore, B.J. Peterson, G.R. Shaver, and G.M. Woodwell. 1983. Changes in the carbon content of terrestrial biota and soils between 1860 and 1980: A net release of CO2 to the atmosphere. Ecological Monographs, 53: 235-262.
IPCC (Intergovernmental Panel on Climate Change). 2014a. Climate Change 2014: Impacts, Adaptation, and Vulnerability. IPCC, Cambridge, UK. http://www.ipcc.ch/report/ar5/wg2/
IPCC (Intergovernmental Panel on Climate Change). 2014b. Summary for Policymakers. Pp. 1-32 in: Climate Change 2014: Impacts, Adaptation, and Vulnerability. Part A: Global and Sectoral Aspects. IPCC, Cambridge, UK. http://www.ipcc.ch/report/ar5/wg2/
Jacobson, M.Z. 2005. Studying ocean acidification with conservative, stable numerical schemes for non-equilibrium air-ocean exchange and ocean equilibrium chemistry. Journal of Geophysical Research, Atmospheres, 110, Issue D7.
Jones, P.D., D.E. Parker, T.J. Osborn, and K.R. Briffa. 2013. Global and Hemispheric Temperature Anomalies—Land and Marine Instrumental Records. Carbon Dioxide Information Analysis Center, Oak Ridge National Laboratory, Oak Ridge, TN. http://dx.doi.org/10.3334/CDIAC/cli.002
Keeling, R.F., S.C. Piper, A.F. Bollenbacher, and S.J. Walker. 2008. Atmospheric CO2-curve values (ppmv) derived from flask air samples collected at Alert, Northwest Territories, Scripps CO2 Program, Scripps Institution of Oceanography, La Jolla, CA. https://web.archive.org/web/20170908151915/http://cdiac.ornl.gov/ftp/trends/co2/altsio.co2
Keeling, R.F., S.C. Piper, A.F. Bollenbacher, and S.J. Walker. 2015. Atmospheric CO2 concentrations (ppm) derived from in situ air measurements at Mauna Loa, Observatory, Hawaii. Scripps CO2 Program, Scripps Institution of Oceanography, La Jolla, CA. http://scrippsco2.ucsd.edu/
Keeling, C.D. and T.P. Whorf. 2005. Atmospheric CO2 records from sites in the SIO air sampling network. Oak Ridge, TN: Carbon Dioxide Information Analysis Centre. http://cdiac.esd.ornl. gov/trends/CO2/contents.htm Lovejoy, T. and L. Hannah (eds.). 2005. Climate Change and Biodiversity. Yale University Press, New Haven, CT.
Lutkemeier, S., P. Kabat, M. Claussen, P.A. Dirmeyer, J.H.C. Gash, L.B. de Guenni, M. Meybeck, R.A. Pielke, C.J. Vorosmarty, and R.W.A. Hutjes (eds.). 2004. Vegetation, Water, Humans and Climate: A New Perspective on an Interactive System. Springer, Berlin.
Mooney, H.A., B.G. Drake, R.J. Luxmoore, W.C. Oechel, and L.F. Pitelka. 1991. Predicting ecosystem responses to elevated CO2 concentrations. BioScience, 41: 96-104.
Peters, R.L., and Darling, J.D.S. 1985. The greenhouse effect and nature reserves. Bioscience, 35: 707-717. Schneider, S.H. 2003. Climate Change Policy: A Survey. Island Press, Washington, DC.
Solomon, A.M., J.R. Trabolka, D.E. Reichle, and L.D. Voorhees. 1985. The global cycle of carbon. Pp. 1-13 in: Atmospheric Carbon Dioxide and the Global Carbon Cycle. DOE/ER-0239, U.S. Department of Energy, Washington, DC.
Wyman, R.L. (ed.). 1991. Global Climate Change and Life on Earth. Routledge, Chapman & Hall, New York, NY.
