
12 Analyzing Findings
Learning Objectives
By the end of this section, you will be able to:
- Explain what a correlation coefficient tells us about the relationship between variables
- Recognize that correlation does not indicate a cause-and-effect relationship between variables
- Discuss our tendency to look for relationships between variables that do not really exist
- Explain random sampling and assignment of participants into experimental and control groups
- Discuss how experimenter or participant bias could affect the results of an experiment
- Identify independent and dependent variables
Did you know that as sales in ice cream increase, so does the overall rate of crime? Is it possible that indulging in your favourite flavour of ice cream could send you on a crime spree? Or, after committing crime do you think you might decide to treat yourself to a cone? There is no question that a relationship exists between ice cream and crime (e.g., Harper, 2013), but it would be pretty foolish to decide that one thing actually caused the other to occur.
It is much more likely that both ice cream sales and crime rates are related to the temperature outside. When the temperature is warm, there are lots of people out of their houses, interacting with each other, getting annoyed with one another, and sometimes committing crimes. Also, when it is warm outside, we are more likely to seek a cool treat like ice cream. How do we determine if there is indeed a relationship between two things? And when there is a relationship, how can we discern whether it is attributable to coincidence or causation?
Correlational Research
TRICKY TOPIC: CORRELATIONAL RESEARCH
If the video above does not load, click here: https://www.youtube.com/watch?v=9YTYuQa8p-U&feature=youtu.be
For a full transcript of this video, click here
Correlation means that there is a relationship between two or more variables (such as ice cream consumption and crime), but this relationship does not necessarily imply cause and effect. When two variables are correlated, it simply means that as one variable changes, so does the other. We can measure correlation by calculating a statistic known as a correlation coefficient. A correlation coefficient is a number from -1 to +1 that indicates the strength and direction of the relationship between variables. The correlation coefficient is usually represented by the letter r.
The number portion of the correlation coefficient indicates the strength of the relationship. The closer the number is to 1 (be it negative or positive), the more strongly related the variables are, and the more predictable changes in one variable will be as the other variable changes. The closer the number is to zero, the weaker the relationship, and the less predictable the relationships between the variables becomes. For instance, a correlation coefficient of 0.9 indicates a far stronger relationship than a correlation coefficient of 0.3. If the variables are not related to one another at all, the correlation coefficient is 0. The example above about ice cream and crime is an example of two variables that we might expect to have no relationship to each other.
The sign—positive or negative—of the correlation coefficient indicates the direction of the relationship (Figure PR.11). A positive correlation means that the variables move in the same direction. Put another way, it means that as one variable increases so does the other, and conversely, when one variable decreases so does the other. A negative correlation means that the variables move in opposite directions. If two variables are negatively correlated, a decrease in one variable is associated with an increase in the other and vice versa.
The example of ice cream and crime rates is a positive correlation because both variables increase when temperatures are warmer. Other examples of positive correlations are the relationship between an individual’s height and weight or the relationship between a person’s age and number of wrinkles. One might expect a negative correlation to exist between someone’s tiredness during the day and the number of hours they slept the previous night: the amount of sleep decreases as the feelings of tiredness increase. In a real-world example of negative correlation, student researchers at the University of Minnesota found a weak negative correlation (r = -0.29) between the average number of days per week that students got fewer than 5 hours of sleep and their GPA (Lowry, Dean, & Manders, 2010). Keep in mind that a negative correlation is not the same as no correlation. For example, we would probably find no correlation between hours of sleep and shoe size.
As mentioned earlier, correlations have predictive value. Imagine that you are on the admissions committee of a major university. You are faced with a huge number of applications, but you are able to accommodate only a small percentage of the applicant pool. How might you decide who should be admitted? You might try to correlate your current students’ college GPA with their scores on standardized tests like the SAT or ACT. By observing which correlations were strongest for your current students, you could use this information to predict relative success of those students who have applied for admission into the university.
LINK TO LEARNING
Manipulate this interactive scatterplot to practice your understanding of positive and negative correlation.
Correlation Does Not Indicate Causation
Correlational research is useful because it allows us to discover the strength and direction of relationships that exist between two variables. However, correlation is limited because establishing the existence of a relationship tells us little about cause and effect. While variables are sometimes correlated because one does cause the other, it could also be that some other factor, a confounding variable, is actually causing the systematic movement in our variables of interest. In the ice cream/crime rate example mentioned earlier, temperature is a confounding variable that could account for the relationship between the two variables.
Even when we cannot point to clear confounding variables, we should not assume that a correlation between two variables implies that one variable causes changes in another. This can be frustrating when a cause-and-effect relationship seems clear and intuitive. Think back to our discussion of the research done by the American Cancer Society and how their research projects were some of the first demonstrations of the link between smoking and cancer. It seems reasonable to assume that smoking causes cancer, but if we were limited to correlational research, we would be overstepping our bounds by making this assumption.
Unfortunately, people mistakenly make claims of causation as a function of correlations all the time. Such claims are especially common in advertisements and news stories. For example, recent research found that people who eat cereal on a regular basis achieve healthier weights than those who rarely eat cereal (Frantzen, Treviño, Echon, Garcia-Dominic, & DiMarco, 2013; Barton et al., 2005). Guess how the cereal companies report this finding. Does eating cereal really cause an individual to maintain a healthy weight, or are there other possible explanations, such as, someone at a healthy weight is more likely to regularly eat a healthy breakfast than someone who is obese or someone who avoids meals in an attempt to diet (Figure PR.12)? While correlational research is invaluable in identifying relationships among variables, a major limitation is the inability to establish causality. Psychologists want to make statements about cause and effect, but the only way to do that is to conduct an experiment to answer a research question. The next section describes how scientific experiments incorporate methods that eliminate, or control for, alternative explanations, which allow researchers to explore how changes in one variable cause changes in another variable.
Illusory Correlations
The temptation to make erroneous cause-and-effect statements based on correlational research is not the only way we tend to misinterpret data. We also tend to make the mistake of illusory correlations, especially with unsystematic observations. Illusory correlations, or false correlations, occur when people believe that relationships exist between two things when no such relationship exists. One well-known illusory correlation is the supposed effect that the moon’s phases have on human behaviour. Many people passionately assert that human behaviour is affected by the phase of the moon, and specifically, that people act strangely when the moon is full (Figure PR.13).
There is no denying that the moon exerts a powerful influence on our planet. The ebb and flow of the ocean’s tides are tightly tied to the gravitational forces of the moon. Many people believe, therefore, that it is logical that we are affected by the moon as well. After all, our bodies are largely made up of water. A meta-analysis of nearly 40 studies consistently demonstrated, however, that the relationship between the moon and our behaviour does not exist (Rotton & Kelly, 1985). While we may pay more attention to odd behaviour during the full phase of the moon, the rates of odd behaviour remain constant throughout the lunar cycle.
Why are we so apt to believe in illusory correlations like this? Often we read or hear about them and simply accept the information as valid. Or, we have a hunch about how something works and then look for evidence to support that hunch, ignoring evidence that would tell us our hunch is false; this is known as confirmation bias. Other times, we find illusory correlations based on the information that comes most easily to mind, even if that information is severely limited. And while we may feel confident that we can use these relationships to better understand and predict the world around us, illusory correlations can have significant drawbacks. For example, research suggests that illusory correlations—in which certain behaviours are inaccurately attributed to certain groups—are involved in the formation of prejudicial attitudes that can ultimately lead to discriminatory behaviour (Fiedler, 2004).
Causality: Conducting Experiments and Using the Data
As you’ve learned, the only way to establish that there is a cause-and-effect relationship between two variables is to conduct a scientific experiment. Experiment has a different meaning in the scientific context than in everyday life. In everyday conversation, we often use it to describe trying something for the first time, such as experimenting with a new hair style or a new food. However, in the scientific context, an experiment has precise requirements for design and implementation.
TRICKY TOPIC: EXPERIMENTAL RESEARCH
If the video above does not load, click here: https://www.youtube.com/watch?v=9YTYuQa8p-U&feature=youtu.be
For a full transcript of this video, click here
The Experimental Hypothesis
In order to conduct an experiment, a researcher must have a specific hypothesis to be tested. As you’ve learned, hypotheses can be formulated either through direct observation of the real world or after careful review of previous research. If you’ve ever spent time with a young child in a car you may have seen them mimicking the actions of the adult driving, pretending to turn the steering wheel or honk the horn. You may have also seen this kind of imitation in less neutral contexts, like a child repeating offensive language that they clearly don’t understand. Based on this observation, it would be reasonable to think that children have a tendency to imitate behaviour they observe from others. You might make further observations from here, for example you might notice that children more often imitate behaviours performed by adults rather than other children, or that this tendency for imitation could facilitate the development of aggressive behaviours in children.

These sorts of personal observations are what often lead us to formulate a specific hypothesis, but we cannot use limited personal observations and anecdotal evidence to rigorously test our hypothesis. Instead, to find out if real-world data supports our hypothesis, we have to conduct an experiment.
Designing an Experiment
The most basic experimental design involves two groups: the experimental group and the control group. The two groups are designed to be the same except for one difference— experimental manipulation. The experimental group gets the experimental manipulation—that is, the treatment or variable being tested (in this case, the use of technology)—and the control group does not. Since experimental manipulation is the only difference between the experimental and control groups, we can be sure that any differences between the two are due to experimental manipulation rather than chance.
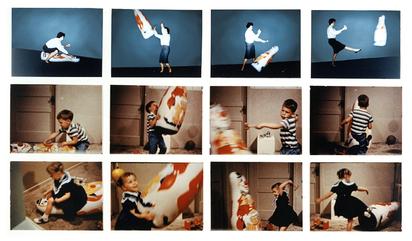
To investigate the relationship between observed aggression and imitated aggressive behaviour in children, our experimental manipulation will be to allow children to observe an adult modeling aggressive behaviour. We might have the children in our experimental group play in a room where they are able to observe adults playing aggressively with toys, hitting, pushing and yelling at them. The study we are describing here is actually a simplified version of the famous 1961 Bobo doll study performed by Albert Bandura, Dorothea Ross, and Sheila A. Ross, named as such because the toy used to demonstrate aggression was an inflatable clown doll called Bobo. We will touch more on work done by Bandura in greater detail in section 57 on observational learning.
We’ve decided our experimental condition will involve allowing children to observe adults modelling aggressive behaviour, we now need to design a control group that differs only by a lack of exposure to aggressive adult models. The original version of the Bobo doll study had a control group that did not observe any behaviour at all. Knowing what you now know about experimental design, would you design your control group in the same way? If a control group is meant to differ from an experimental group only in terms of the experimental manipulation, you might argue that a group exposed to nothing differs in several ways. For example, the experience of being made to sit in a room with a strange adult could theoretically provoke acts of aggression in young children. It might seem far-fetched, but we cannot infer that observation of aggression was the cause of our participant’s behaviour if we don’t rule out the possibility that other features of our manipulation could have contributed. The researchers used a second experimental group to rule out this possibility, but for the purposes of our hypothetical replication we have an experimental group who observe adults behaving aggressively with toys, and a control group who observe adults behaving non-aggressively with the same toys.
One of the most important parts of a scientific study is having a clear description of how each variable is measured, known as an operational definition. Some variables, like age and height, are easy to define, but psychologists are often interested in measuring abstract variables like thought, emotion, and behaviour which can be challenging. For example, can you operationally define helpfulness? People vary in how helpful they are, so there must be some way to measure this. This could be measured by looking at charitable donations on annual tax returns, but that’s only one type of helpfulness and is biased towards wealthier individuals. What about number of hours per week volunteering? This operational definition also has its limitations in capturing helping behaviour. In our Bobo doll study, we will have to define aggression, which could be described in a variety of ways. For example, one might define aggression as hostile, injurious, or destructive behaviour caused by frustration. However, this definition would require us to also measure frustration, as this feature is not externally observable. Researchers often create different operational definitions of the same variable, so providing a clear, measurable description is important in interpreting research findings.
While it is possible to measure frustration through self-report, our study is interested in imitative aggression, and we do not know that imitative aggression is caused by frustration. So for the purposes of our hypothetical experiment, we could define aggressive behaviour as physical or verbal acts that have the potential to cause harm to an object or another human. We could then describe specific, observable aggressive behaviours like kicking the doll, throwing it, or saying things like “stupid doll”. Our adult models could perform these specific behaviours, and we could measure the rate at which participants imitate those acts when given an opportunity to play with the same doll later. The imitation of those previously described acts would be considered imitative aggression. Having defined our variables like this, we are able to communicate specifically what we have measured, which makes it easier for other researchers to replicate our experiment and check our results.
We’ve operationalized our variables, so now we can decide how our experiment will run. In this case, we could allow our participants to play in a room with an adult model who would perform a set of specifically defined behaviours (either aggressive or non-aggressive) to a doll. We could then move our participants to a different room with the same set of toys and count how many of those specifically defined behaviours they reproduce.
Ideally, the people who count imitated behaviours are unaware of who was assigned to the experimental or control group, in order to control for experimenter bias. Experimenter bias refers to the possibility that a researcher’s expectations might skew the results of the study. Remember, conducting an experiment requires a lot of planning, and the people involved in the research project have a vested interest in supporting their hypotheses. If the observers knew which child was in which group, it might influence how they interpret ambiguous responses, such as squeezing the doll. By being blind to which child is in which group, we protect against those biases. This situation is a single-blind study, meaning that one of the groups (participants) are unaware as to which group they are in (experiment or control group) while the researcher who developed the experiment knows which participants are in each group.
In a double-blind study, both the researchers and the participants are blind to group assignments, which allows us to control for both experimenter and participant expectations. A well-known example of this is the placebo effect, which occurs when people’s expectations or beliefs influence or determine their experience in a given situation. In other words, simply expecting something to happen can actually make it happen.
To illustrate, imagine that you have bad allergies and are taking part in a study testing a new allergy medication. You go to a university or hospital setting to take part in the experiment, speaking to people in lab coats with medical authority who do a number of tests on you and then give you a pill. Whether the pill contains actual medication or not, the experience of taking part and receiving the pill may give the treatment a sense of legitimacy. You may feel hopeful and proactive about your bad allergies, and as a result you may notice an actual improvement in symptoms even if you only took a sugar pill.
As we know, we can only say that our experimental manipulation (in this case the medication) is the cause of our results if it is the only difference between the experimental and control groups. As a result, we might use a placebo control, where the only difference between the two groups would be the contents of the pill- medicine or something inert. To ensure that all other conditions are the same, participants must not know whether they have received the drug- if they knew, we wouldn’t be able to tell whether the effects were due to expectations about drug efficacy or to the actual drug. Similarly, if the researchers know which drug participants are receiving they might treat participants differently, which could alter the way participants respond (Figure PR.15).
In a research experiment, we strive to study whether changes in one thing cause changes in another. To achieve this, we must pay attention to two important variables, or things that can be changed, in any experimental study: the independent variable and the dependent variable. Anindependent variable is manipulated or controlled by the experimenter. In a well-designed experimental study, the independent variable is the only important difference between the experimental and control groups. In our example of how the observation of aggressive behaviour affects later behaviour, the independent variable is the type of behaviour observed by the participants. (Figure PR.16). A dependent variable is what the researcher measures to see how much effect the independent variable had.In our example, the dependent variable is the number of modelled aggressive behaviours our participants imitate.
We expect that the dependent variable will change as a function of the independent variable. In other words, the dependent variable depends on the independent variable. A good way to think about the relationship between the independent and dependent variables is with this question: What effect does the independent variable have on the dependent variable?In our example of how the observation of aggressive behaviour affects later behaviour, the independent variable is the type of behaviour observed by the participants.
Selecting and Assigning Experimental Participants
Now that our study is designed, we need to obtain a sample of individuals to include in our experiment. Our study involves human participants so we need to determine who to include. Participants are the subjects of psychological research, and as the name implies, individuals who are involved in psychological research actively participate in the process. Often, psychological research projects rely on college students to serve as participants. In fact, the vast majority of research in psychology subfields has historically involved students as research participants (Sears, 1986; Arnett, 2008). But are college students truly representative of the general population? College students tend to be younger, more educated, more liberal, and less diverse than the general population. Although using students as test subjects is an accepted practice, relying on such a limited pool of research participants can be problematic because it is difficult to generalize findings to the larger population.
Our hypothetical experiment involves preschool aged children, so we need to generate a sample from that population. Samples are used because populations are usually too large to reasonably involve every member in our particular experiment (Figure PR.17). If possible, we should use a random sample (there are other types of samples, but for the purposes of this chapter, we will focus on random samples). A random sample is a subset of a larger population in which every member of the population has an equal chance of being selected. Random samples are preferred because if the sample is large enough we can be reasonably sure that the participating individuals are representative of the larger population. This means that the percentages of characteristics in the sample—sex, ethnicity, socioeconomic level, and any other characteristics that might affect the results—are close to those percentages in the larger population. Additionally, random sampling ensures that differences in characteristics are relatively balanced between groups.
In our example, we’re interested in pre-school aged children, but we can’t possibly include all pre-school aged children in our study so we need to be more specific; instead we might say our population of interest is all pre-school aged children in a particular city. We should include children from various income brackets, family situations, races, ethnicities, religions, and geographic areas of town. With this more manageable population, we can work with local preschools to select a random sample of around 200 children who we want to participate in our experiment.
In summary, because we cannot test all of the pre-school aged children in a city, we want to find a group of about 200 that reflects the composition of that city. With a representative group, we can generalize our findings to the larger population without fear of our sample being biased in some way. In the original version of this study, the sample was composed of 72 children from the Stanford University Nursery School. Can you think of some ways in which a sample drawn exclusively from a wealthy universities’ nursery school might be biased?
Now that we have a sample, the next step of the experimental process is to split the participants into experimental and control groups through random assignment. With random assignment, all participants have an equal chance of being assigned to either group. There is statistical software that will randomly assign each of the children in the sample to either the experimental or the control group.
Random assignment is critical for sound experimental design. With sufficiently large samples, random assignment makes it unlikely that there are systematic differences between the groups. So, for instance, it would be very unlikely that we would get one group composed entirely of males, a given ethnic identity, or a given religious ideology. This is important because if the groups were systematically different before the experiment began, we would not know the origin of any differences we find between the groups: Were the differences preexisting, or were they caused by manipulation of the independent variable? Even using random assignment it is possible to have groups that differ significantly from each other, so it is important to monitor any variable we think might impact our results. If we do find that a variable of interest differs significantly between groups, we can match them on that variable. Matching is a practice where participants in the experimental group are paired with participants in the control group that have similar scores on a variable of interest. For example, In the Bobo doll study participants were scored on their baseline levels of aggression. If their experimental group was found to be significantly more aggressive than their control group prior to any experimental manipulation, then they would not have been able to infer that the results were due to their manipulation. To avoid this outcome the researchers matched children in different groups with similar levels of baseline aggression, so that the groups would be roughly equivalent on that variable. Random assignment, monitoring variables, and matching allow us to assume that any differences observed between experimental and control groups result from the manipulation of the independent variable.
LINK TO LEARNING
Issues to Consider
While experiments allow scientists to make cause-and-effect claims, they are not without problems. True experiments require the experimenter to manipulate an independent variable, and that can complicate many questions that psychologists might want to address. For instance, imagine that you want to know what effect sex (the independent variable) has on spatial memory (the dependent variable). Although you can certainly look for differences between people with different biological sexes on a task that taps into spatial memory, you cannot directly control a person’s sex. We categorize this type of research approach as quasi-experimental and recognize that we cannot make cause-and-effect claims in these circumstances.
Experimenters are also limited by ethical constraints. For instance, you would not be able to conduct an experiment designed to determine if experiencing abuse as a child leads to lower levels of self-esteem among adults. To conduct such an experiment, you would need to randomly assign some experimental participants to a group that receives abuse, and that experiment would be unethical.
Interpreting Experimental Findings
Once data is collected from both the experimental and the control groups, a statistical analysis is conducted to find out if there are meaningful differences between the two groups. A statistical analysis determines how likely any difference found is due to chance (and thus not meaningful). For example, if an experiment is done on the effectiveness of a nutritional supplement, and those taking a placebo pill (and not the supplement) have the same result as those taking the supplement, then the experiment has shown that the nutritional supplement is not effective. Generally, psychologists consider differences to be statistically significant if there is less than a five percent chance of observing them if the groups did not actually differ from one another. Stated another way, psychologists want to limit the chances of making “false positive” claims to five percent or less.
The greatest strength of experiments is the ability to assert that any significant differences in the findings are caused by the independent variable. This occurs because random selection, random assignment, and a design that limits the effects of both experimenter bias and participant expectancy should create groups that are similar in composition and treatment. Therefore, any difference between the groups is attributable to the independent variable, and now we can finally make a causal statement. If we find that observing aggressive behaviour results in more imitated aggression than observing non-aggressive behaviour, we can safely say that exposure to aggressive behaviour causes an increase in imitated aggression.
For a full transcript of this video, click here
Reporting Research
When psychologists complete a research project, they generally want to share their findings with other scientists. The American Psychological Association (APA) publishes a manual detailing how to write a paper for submission to scientific journals. Unlike an article that might be published in a magazine like Psychology Today, which targets a general audience with an interest in psychology, scientific journals generally publish peer-reviewed journal articles aimed at an audience of professionals and scholars who are actively involved in research themselves.
LINK TO LEARNING
A peer-reviewed journal article is read by several other scientists (generally anonymously) with expertise in the subject matter. These peer reviewers provide feedback—to both the author and the journal editor—regarding the quality of the draft. Peer reviewers look for a strong rationale for the research being described, a clear description of how the research was conducted, and evidence that the research was conducted in an ethical manner. They also look for flaws in the study’s design, methods, and statistical analyses. They check that the conclusions drawn by the authors seem reasonable given the observations made during the research. Peer reviewers also comment on how valuable the research is in advancing the discipline’s knowledge. This helps prevent unnecessary duplication of research findings in the scientific literature and, to some extent, ensures that each research article provides new information. Ultimately, the journal editor will compile all of the peer reviewer feedback and determine whether the article will be published in its current state (a rare occurrence), published with revisions, or not accepted for publication.
Peer review provides some degree of quality control for psychological research. Poorly conceived or executed studies can be weeded out, well-designed research can be improved, and ideally, studies can be described clearly enough to allow other scientists to replicate them, which helps to determine reliability.
So why would we want to replicate a study? Imagine that our version of the Bobo doll study is done exactly the same as the original, only using a different set of participants and researchers. We use the same operational definitions, manipulations, measurements, and procedures, and our groups are equivalent in terms of their baseline levels of aggression. In our replication however, we receive completely different results and the children do not imitate aggressive behaviours any more than they would at the level of chance. If our experimental manipulation is exactly the same, then the difference in results must be attributable to something else that is different between our study and the original, which might include the researchers, participants, and location. If on the other hand, we were able to replicate the results of the original experiment using different researchers and participants at a different location, then this would provide support for the idea that the results were due to the manipulation and not to any of these other variables. The more we can replicate a result with different samples, the more reliable it is.
In recent years, there has been increasing concern about a “replication crisis” that has affected a number of scientific fields, including psychology. One study found that only about 62% of social science studies reviewed were replicable, and even then their effect sizes were reduced by half (Cramerer et. al, 2018). In fact, even a famous Nobel Prize-winning scientist has recently retracted a published paper because she had difficulty replicating her results (Nobel Prize-winning scientist Frances Arnold retracts paper, 2020 January 3). These kinds of outcomes have prompted some scientists to begin to work together and more openly, and some would argue that the current “crisis” is actually improving the ways in which science is conducted and in how its results are shared with others (Aschwanden, 2018). One example of this more collaborative approach is the Psychological Science Accelerator, a network of over 500 laboratories, representing 82 countries. This network allows researchers to pre-register their study designs, which minimizes any cherry-picking that might happen along the way to boost results. The network also facilitates data collection across multiple labs, allowing for the use of large, diverse samples and more wide-spread sharing of results. Hopefully with a more collaborative approach, we can develop a better process for replicating and quality checking research.
LINK TO LEARNING
DIG DEEPER
The Vaccine-Autism Myth and Retraction of Published Studies
Some scientists have claimed that routine childhood vaccines cause some children to develop autism, and, in fact, several peer-reviewed publications published research making these claims. Since the initial reports, large-scale epidemiological research has suggested that vaccinations are not responsible for causing autism and that it is much safer to have your child vaccinated than not. Furthermore, several of the original studies making this claim have since been retracted.
A published piece of work can be rescinded when data is called into question because of falsification, fabrication, or serious research design problems. Once rescinded, the scientific community is informed that there are serious problems with the original publication. Retractions can be initiated by the researcher who led the study, by research collaborators, by the institution that employed the researcher, or by the editorial board of the journal in which the article was originally published. In the vaccine-autism case, the retraction was made because of a significant conflict of interest in which the leading researcher had a financial interest in establishing a link between childhood vaccines and autism (Offit, 2008). Unfortunately, the initial studies received so much media attention that many parents around the world became hesitant to have their children vaccinated (Figure PR.18). Continued reliance on such debunked studies has significant consequences. For instance, between January and October of 2019, there were 22 measles outbreaks across the United States and more than a thousand cases of individuals contracting measles (Patel et al., 2019). This is likely due to the anti-vaccination movements that have risen from the debunked research. For more information about how the vaccine/autism story unfolded, as well as the repercussions of this story, take a look at Paul Offit’s book, Autism’s False Prophets: Bad Science, Risky Medicine, and the Search for a Cure.
Reliability and Validity
Reliability and validity are two important considerations that must be made with any type of data collection. Reliability refers to the ability to consistently produce a given result. In the context of psychological research, this would mean that any instruments or tools used to collect data do so in consistent, reproducible ways. There are a number of different types of reliability. Some of these include inter-rater reliability (the degree to which two or more different observers agree on what has been observed), internal consistency (the degree to which different items on a survey that measure the same thing correlate with one another), and test-retest reliability (the degree to which the outcomes of a particular measure remain consistent over multiple administrations).
Unfortunately, being consistent in measurement does not necessarily mean that you have measured something correctly. To illustrate this concept, consider a kitchen scale that would be used to measure the weight of cereal that you eat in the morning. If the scale is not properly calibrated, it may consistently under- or overestimate the amount of cereal that’s being measured. While the scale is highly reliable in producing consistent results (e.g., the same amount of cereal poured onto the scale produces the same reading each time), those results are incorrect. This is where validity comes into play. Validity refers to the extent to which a given instrument or tool accurately measures what it’s supposed to measure, and once again, there are a number of ways in which validity can be expressed. Ecological validity (the degree to which research results generalize to real-world applications), construct validity (the degree to which a given variable actually captures or measures what it is intended to measure), and face validity (the degree to which a given variable seems valid on the surface) are just a few types that researchers consider. While any valid measure is by necessity reliable, the reverse is not necessarily true. Researchers strive to use instruments that are both highly reliable and valid.
To illustrate how complicated it can be to determine the validity of a measure, let’s look again at the original Bobo doll study. Bandura and colleagues were not only interested in whether children would imitate aggressive behaviours, they also wanted to know if observing same-sex adults would have a greater impact on children’s behaviour than observing adults of a different sex. So how did they define sex? The children involved in the study were nursery school aged, so it’s likely that the researchers simply did a visual assessment or asked their parents. Generally we now use ‘sex’ to refer to the different biological categories people might fit into, while ‘gender’ refers to the socially constructed characteristics we assign to those categories, and is something an individual must define for themselves. In this case, the researchers were really categorizing their participants based on assumed sex, rather than actual biological sex.
A visual assessment of biological sex might seem to have clear face validity to many people, but as a measurement it is low in construct validity. That is, while it is often assumed that sex can be determined by looking at an individual’s appearance, that approach has little ability to accurately measure biological sex. The assumption that biological sex is both binary and visually obvious results in a lack of research in populations of people who exist outside of those assumptions. This in turn means that the measure has little ecological validity, as these people do exist in real-world populations. To illustrate further, let’s consider some of the ways biological sex has been traditionally assessed:
- Visual assessment: In this approach, researchers would record ‘sex’ based on their visual assessment of the clothed participant. This might work for many individuals, but it’s based on an assumption about the individual’s reproductive biology, which is not reliably assessed by external appearance. There are female humans with beards, male humans without Adam’s apples, and of course, transgender, non-binary, and intersex people whose bodies may not fit these assumed categories
- Medical records or birth certificates: In medical research, data is routinely collected about patient’s demographics, so sex may be assessed simply by looking at a participants’ medical record. However, given that biological sex assignment of infants at birth is based a visual assessment of the infant’s external genitalia, which is used to categorize the infant as “male” or “female.” While visually assessing the genitals of an individual may appear to be enough to determine their biological sex, this is unreliable for the reasons outlined above (visual assessment). A larger problem is this method of sex assignment at birth has been incredibly harmful to intersex people.
- Self-report: To avoid the issues described above, it may seem reasonable to ask participants to self-identify. This can present two issues: (1) most people’s understanding of their own biological sex is based on their medical record or birth certificate, and not further testing (thus their beliefs about their biological sex may not be congruent with their actual biology). This may seem unlikely but remember birth certificates and the determination of biological sex of an infant at birth is not a foolproof way of getting this information. And, (2) as with all self-report measures, it’s reliant upon the researchers providing appropriate categories (i.e., has intersex been included as an option) and the participant being truthful. Participants may not readily volunteer this information for reasons of privacy, safety, or simply because it makes navigating the world easier for them.
While it may seem like something that ought to be easy, truly determining the biological sex of an individual can be difficult. The biological sex of an individual is determined by more than their external genitals, or whether they have a penis/vagina. Some other determinants of biological sex include the internal gonads (ovaries or testes), predominant hormones (testosterone or estrogen), and chromosomal DNA (e.g., XX, XY). It is often assumed that the chromosomal DNA of a person is the truest indicator of their biological sex, however this does not always “match” gonadal, hormonal, or genital sex. Intersex is a general term applied to a variety of conditions which result in a person being born with anatomy that defies traditional male-female categorization. This could result in a person having atypical external genitalia, genitals that don’t align with internal reproductive organs, or atypical chromosomal structures (despite typical anatomy). For instance, a person could be born with mosaic genetics, with both XX and XY chromosomes. These conditions may be present at birth, but often a person has no reason to suspect they are intersex until they reach puberty. In some cases, the condition may not even be discovered until post-mortem during a medical autopsy.
It’s not impossible to determine an individual’s biological sex, but sex should be operationally defined and data should be collected accordingly. As you go learn more about the scientific process and research, it’s important to critically evaluate methods and findings. Participants are frequently divided into male-female categories and it’s worth exploring the details of the methods to understand how scientists have actually measured biological sex and whether their approach may impact the validity of their conclusions.
LINK TO LEARNING
Now that we understand the complexity of measuring biological sex, let’s consider how it was it was assessed in the original Bobo doll study. There is no mention of biological measures being taken so we can assume that sex categorization was based on visual assessment or by report from the children’s parents. We know now that this is not an accurate way to measure biological sex, so we should consider why sex was included in the experiment. Given that children were found to perceive their parents as having preferences for them to behave in ‘sex appropriate’ ways (eg. Girls playing with dolls and boys playing with trucks), the researchers hypothesized their participants would be more likely to imitate the behaviour of a same-sex model than a model of a different sex. They were interested in the effect that socially reinforced gender roles would have on imitated behaviour so the assumed sex of the children was all that mattered, as this would determine what behaviours would be discouraged or reinforced by adults. It’s ok that no biological measures were taken for this study because biological sex wasn’t actually relevant, but terms like sex and gender have often used interchangeably in research so it’s important to think critically about how constructs are being operationally defined and measured. If Bandura and colleagues were to replicate this study today, we should hope that they would be more accurate and specific with their terminology and use something like ‘assumed sex/gender’ rather than ‘sex’ to refer to the variable they were interested in. After all, this kind of specificity in language allows for more accurate understanding and replication, which can increase our confidence in their original conclusion. As you move forward in your degree and engage in research more directly, consider carefully what variables you are interested in, and do your best to choose language that is both specific and accurate.
