
20 The Brain and Spinal Cord
Learning Objectives
By the end of this section, you will be able to:
- Explain the anatomy and functions of the spinal cord
- Name the major areas of the hindbrain, midbrain, and forebrain, and describe their main functions
- Identify the anatomical and functional divisions of the cortex
- Describe the anatomy and function of the corpus callosum
- Explain brain lateralization and give examples of lateralization in humans
- Contrast the roles of Broca’s area and Wernicke’s area in language ability
- Describe how neuroscientists measure brain activity
The brain is a complex organ with billions of interconnected neurons and glia. These cells are the basis of communication in the nervous system, which is organized into specialized structures that provide the foundation for thought, emotion, and behaviour. In this section, we discuss the overall organization of the nervous system and the functions associated with different areas, beginning with the spinal cord.
The Spinal Cord
The spinal cord connects the brain to the outside world. It works like a relay station to direct messages to and from the brain, and also has its own system of automatic processes, called reflexes.
The top of the spinal cord is a bundle of nerves that merges with the brain stem, where many basic life processes, like breathing and digestion, are controlled. The spinal cord itself ends just below the ribs while its nerves extend all the way to the base of the spine. It’s functionally organized into 31 segments, each connected to a specific part of the body through the peripheral nervous system. Nerves branch out from the spine at each vertebra: sensory nerves bring messages in; motor nerves send messages out to the muscles and organs.
The spinal cord is set up to make simple decisions about incoming sensory messages without requiring input from the brain. This is the basis of several types of reflexes such as knee jerk and pain withdrawal reflexes. When a sensory message meets certain parameters, its signal passes from the sensory nerve to a spinal interneuron, which then activates a motor neuron to initiate movement. This happens before the brain receives information about the painful stimulus, so this automatic spinal reflex allows the body to react very quickly.
The spinal cord is protected by bony vertebrae and cushioned in cerebrospinal fluid, but injuries still occur. When the spinal cord is damaged in a particular segment, all lower segments are cut off from the brain, usually causing paralysis and loss of sensation. Therefore, someone with a severe spinal injury at the level of the hips will keep motor control and sensation in more body parts than someone with a spinal injury at the level of the shoulders. The higher the damage occurs, the greater the loss of function and sensation.
Hindbrain Structures
The hindbrain is located at the back of the head and looks like an extension of the spinal cord. It contains the medulla, pons, and cerebellum (Figure BB.9). The medulla controls the automatic processes of the autonomic nervous system, such as breathing, blood pressure, and heart rate. The word pons literally means “bridge,” and as the name suggests, the pons connects the hindbrain to the rest of the brain. Acting as a bridge, the pons contains several “highways” that send information about body sensations to the brain and bring directions for body movement down to the spinal cord. The pons is also involved in regulating sleep and pain signals. The medulla and pons are part of the brainstem, which extends to the thalamus in the forebrain.
The cerebellum (Latin for “little brain”) receives messages about muscles, tendons, joints, and head position to control balance, coordination, movement, and fine motor skills. The cerebellum is also thought to be an important area for processing some types of memories. In particular, procedural memory, or memory involved in learning and remembering how to perform tasks, is thought to involve the cerebellum.
Midbrain Structures
The midbrain, located between the forebrain and the hindbrain, is home to a curious collection of structures involved in diverse functions. The superior colliculus is important in directing eye movements towards important aspects of a visual scene, while the inferior colliculus is involved in sound localization. Both structures direct behaviours to parts of the environment that are relevant to an individual at that moment in time. The midbrain also contains structures that are involved in the sleep/wake cycle, arousal, and motor activity. These structures include the substantia nigra (Latin for “black substance”) and the ventral tegmental area (VTA) (Figure BB.10), which both contain cell bodies that produce the neurotransmitter dopamine and project to areas of the forebrain. The substantia nigra is important for planning and control of voluntary movement, and degeneration of these dopaminergic neurons is thought to be the main cause of the neurological disorder, Parkinson’s disease (Parent & Parent, 2010). The VTA sends parallel projections to the forebrain and is involved in reward and motivation, alterations in the neuronal signalling in this pathway is linked to addictive behaviours, such as substance misuse and gambling (George & Le Moal, 2012)
Forebrain Structures
The cerebral cortex makes up the majority of the forebrain (Figure BB.12), the largest part of the brain. In addition to the cortex the forebrain contains a number of other subcortical structures including the thalamus, hypothalamus, pituitary gland, and a collection of areas called the limbic system.
If the video above does not load, click here: https://youtu.be/GeaguTUo__4
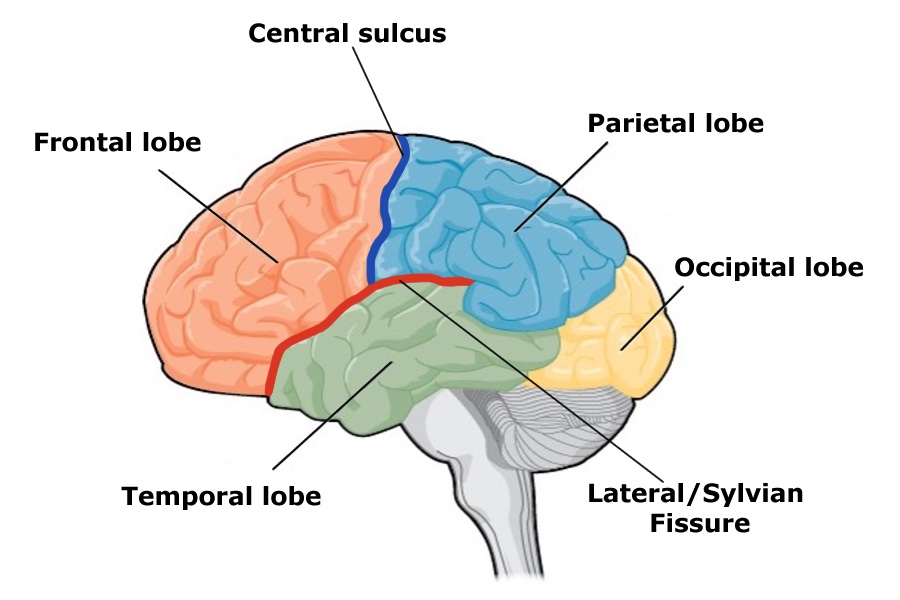
Lobes of the Cerebral Cortex
The size and location of the cerebral cortex makes it vulnerable to damage from injury and disease, however this is not usually fatal. In fact, most of what we’ve learned about the human cortex comes from observations of people living with damage to specific areas. If someone loses function after a brain injury, the damaged area was probably involved in that function.
Probably the most famous case of brain damage is Phineas Gage:
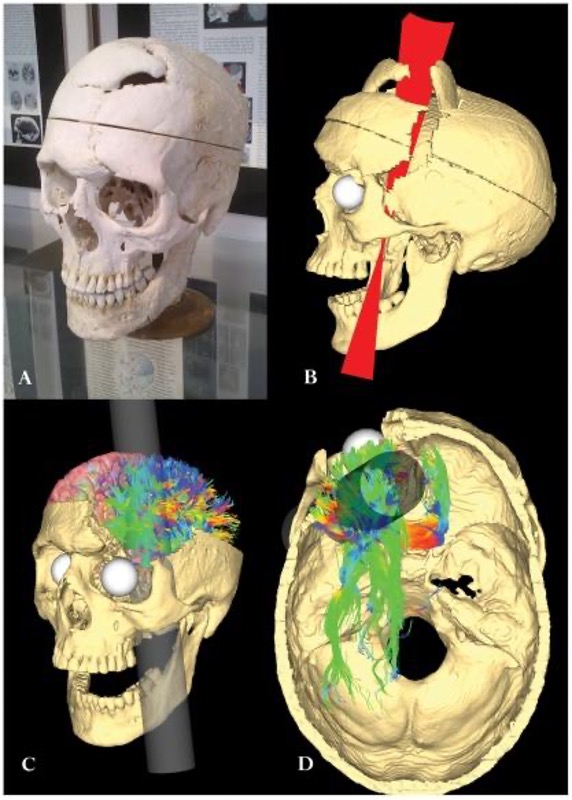
On September 13, 1848, 25-year old Gage was working as a railroad foreman. He and his crew were using an iron rod to tamp explosives into a blasting hole to remove rock along the railway’s path. Unfortunately, this created a spark and the rod exploded out of the hole, into Gage’s face, and through his skull (Figure BB.14). It passed through the left frontal lobe and exited between the parietal and frontal bones of the skull.
Remarkably, Gage was conscious and capable of moving and talking within minutes. In the following months he had a severe fungal infection of the brain and was cared for by doctor John Martyn Harlow (Harlow, 1848). Harlow’s notes provide the most direct information on Gage’s recovery.
In the months following the injury, Harlow wrote that Gage was improving, but he had trouble with self control. His friends also noted this with reports of overspending and inappropriate social behaviour, like swearing (Harlow, 1968). Within three months Gage was healthy enough to move home, but hadn’t recovered enough to resume his duties as a foreman. However, just four years later he moved to Chile to establish a line of stage coaches; a job that involved scheduling, managing finances, and interacting with passengers during long journeys. It seems unlikely that this would have been possible for the rude, unpredictable man often described in this case (Macmillan & Lena, 2010).
Harlow didn’t have access to imaging technology so we aren’t sure what structures were affected by Gage’s injury, or which structures adapted so he could recover. Luckily, we can use modern techniques to make an educated guess about what happened to Gage’s brain. A study from 2012 (Van Horn et al., 2012) used Gage’s skull along with imaging data from similar living subjects to model the damage based on the rod’s trajectory (Figure BB. 15). This model suggested that the left orbitofrontal cortex in the frontal lobe was severely damaged. The majority of connective pathways from the left frontal lobe to other areas, including the limbic system, were also affected. Further inspection of Gage’s skull indicates that there may have also been some direct damage to the amygdala (Szczepanski & Knight, 2014).
So what kind of impairments do we commonly see after damage to these areas? Patients with damage to similar areas of the prefrontal cortex show higher scores on tests of impulsivity, taking less time to consider tasks and plan action, and making more errors. These patients are also less likely to change their behaviour in response to consequences, report more inappropriate social behaviours, and more feelings of anger (Berlin et al., 2004, Szepanski & Knight, 2015), similar to what Gage experienced. In fact, Harlow’s research with Gage prompted him to coin the term Frontal Lobe Syndrome, a term describing deficits in motivation, planning, social behaviour, and language production that can appear after damage to the prefrontal cortex (Pirau & Lui, 2021). Gage’s case provides a memorable demonstration of frontal lobe function, but it also shows the brain’s remarkable ability to adapt and regain function after injury.
Brain damage studies provide important information about the cortex but advancements in medicine and technology have since given us more precise methods for investigating the brain. A foundational example comes from neurosurgeon Wilder Penfield, who systematically studied the effects of electrical stimulation on different parts of the cortex. At the very back end of the frontal lobe, just before the central sulcus, is a strip of cortex called the precentral gyrus and is home to the primary motor cortex, an area that activates movements after we decide to make them. Most of what we know about this part of the brain comes from classic research in epilepsy patients done by Penfield and associates Theodore Rassmussen and Edwin Boldrey.
Some patients don’t respond to anti-seizure drugs, so in severe cases the seizure-inducing part of the brain is removed. To ensure that only the problematic brain tissue was removed, these researchers stimulated the brains of awake, anesthetized patients with a mild electric current and asked them to report their sensations. When he stimulated neurons in the primary motor cortex, patients reported movements of body parts on the opposite side. In other words, the right primary motor cortex controls movement of body parts on the left and the left primary motor cortex controls movement on the right. This arrangement is referred to as contralateral, meaning opposite side. These movement-controlling areas can be understood as representations of the body parts they activate, and stimulation studies indicate that they are laid out in the brain in the same order as they appear in the body. For example, finger neurons are located next to hand neurons which are located next to arm neurons, see figure BB.16 (Penfield & Boldrey, 1937). This is called somatotopy, the concept that parts of the body correspond to specific parts of the cortex.
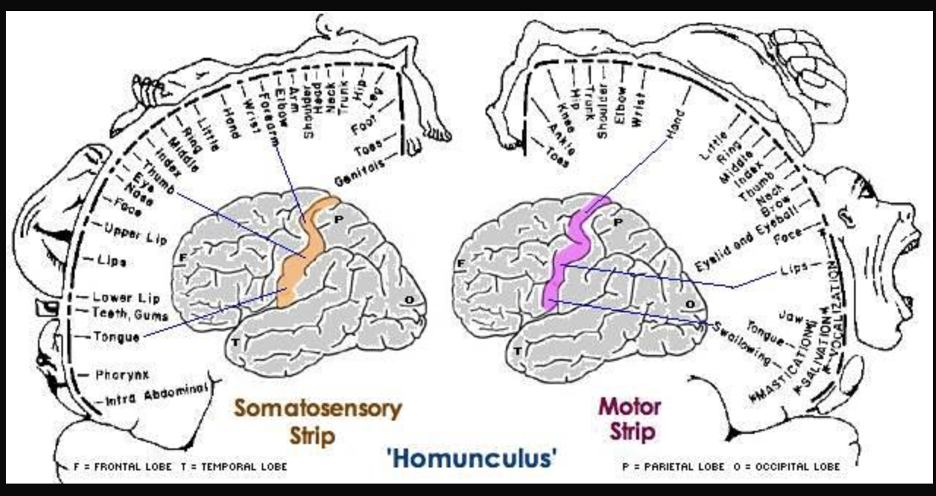
Just behind the motor cortex on the other side of the central sulcus is the primary somatosensory cortex. This strip of cortex is at the beginning of the parietal lobe, and it plays an essential role in the perception of touch, temperature, and pain. Penfield discovered that electrical stimulation of this area produces tactile sensations in different regions of the body on the contralateral side. Like in the primary motor cortex, neurons in the primary somatosensory cortex are also grouped by body part, so that the arrangement in the body is maintained on the surface of the cortex (Figure BB.16). Note that the size of body parts on both these motor and touch maps is distorted, with huge amounts of cortical space devoted to the fingers, hands, and mouth compared to the arms, legs, and torso (Penfield & Boldery, 1937; Penfield & Rasmussen, 1950). The areas of the body that we have more control over or which are more sensitive have the most cortical space. For example, the fingers have more cortical space than the chin, which is much less sensitive and can’t carry out coordinated movement.
Penfield’s representation of the brain’s somatosensory “touch map” as a two-dimensional homunculus or ‘little man’ is one of the most recognizable images in neuroscience. Every introductory Psychology textbook has some version of it, along with its twin, the “motor map”, located next door in the frontal lobe. These images demonstrate that 1) the map of the body is retained in the brain and 2) the size of a body part’s representation is related to its function rather than its physical size. These features are key to understanding the way movement and somatosensation are coded in the brain.
DIG DEEPER
Does the classic homunculus represent us all?
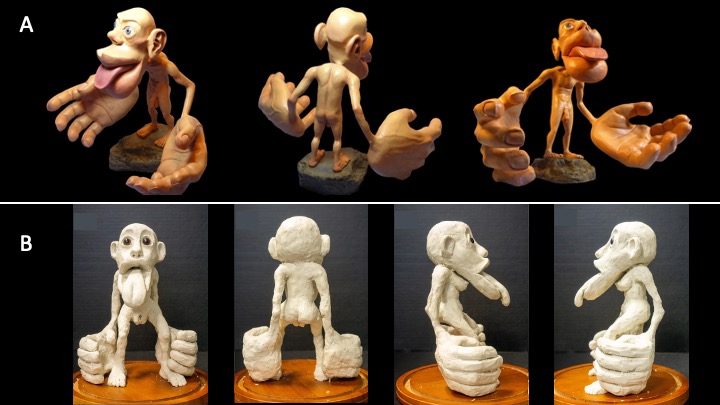
The somatosensory homunculus is a popular depiction of somatotopy for mainstream culture. You might have seen one of these three-dimensional figures in a museum or at themed exhibits like Ripley’s Believe It or Not. Often, the homunculus is presented as a demonstration of neural organization in a neutral human body, even though it depicts a person with a penis and testicles. What about bodies that don’t have those parts? Glaringly, Penfield didn’t make a homunculus with breasts, vagina, clitoris, uterus or ovaries (Di Noto et al., 2012), even though he studied people with those body parts.
It’s possible that Penfield and associates didn’t make an equivalent map because they didn’t have a big enough sample of people with that anatomy, but it’s likely that this exclusion was also influenced by gender or sex-based bias. This bias can be demonstrated in the language these researchers chose. He/him pronouns were always used to refer to patients, even though some of them would have used she/her pronouns instead (Penfield & Rasmussen, 1950). This bias has long been present in biomedical research, and persists today. In neuroscience specifically, studies that only use assumed male patients outnumber studies using assumed female patients 5.5:1 (Plevkova et al., 2020).
This gap in the research isn’t just an issue of representation, it has medical implications that lead to the neglect of one half of the population. Importantly, the somatosensory cortex is a focus of research on neuroplasticity because representations of body parts can change if the way they are used is altered . For example, after amputation of an arm, sensory input from the face starts to activate the area of the somatosensory cortex that used to represent the hand. This change in neural representation can also cause changes in perceptual experience like phantom limb syndrome, where an individual experiences sensations or pain that feel like they are coming from the missing limb (Ramachandran & Rogers-Ramachandran, 2000). Without a somatosensory map that represents the bodies of people who were assigned female at birth (AFAB), we can’t assess neuroplasticity after changes to their anatomy.
Consider a common procedure like the mastectomy, the removal of breast tissue. Mastectomies are used to treat breast cancer and also as a gender affirming surgery for trans men and other trans and non-binary people with breasts (Dutta, 2015; Case et al., 2017). Data from people undergoing mastectomy indicates that about 33% of patients show changes in the neural representation of the breast, but we don’t know what that change causes perceptually for those patients (Aglioti et al., 1993; Aglioti et al., 1994; Dutta, 2015). Furthermore, many transgender people describe feelings of disconnection with sexed body parts and some experience phantom limb-like sensations from sexed body parts they weren’t born with. It isn’t surprising that these experiences could relate to differences in the neural representation of those body parts (Ramachandran, 2008; McGeoch et al., 2011). Case et al. (2017) used magnetoencephalography imaging to record brain activity during stimulation of the breast, a body part that many trans men feel disconnected from. Their findings suggest that feelings of disconnection from gender-incongruent body parts in trans men could be related to differences in the neural representation of the body. Mapping the AFAB brain might also have implications for other pain conditions like hysterectomy, vulvodynia, and fibromyalgia (Di Noto et al., 2012).
There have been recent attempts to create a somatosensory homunculus that represents the AFAB body, for example Di Noto et al. (2012) used existing data to create an illustration of AFAB anatomy in Penfield’s 2D homunculus. However, this version is not as precise as the existing homunculus. In 2020, Wright and Foerder created the first 3D somatosensory homunculus to include breasts, nipples, vagina, and clitoris. As of 2022, there is still no comprehensive 2-D map displaying where AFAB body parts are precisely located in the somatosensory cortex. Currently, many of these attempts are being called the hermunculus, but it should be noted that this term could be more inclusive. Trans men and non binary people who don’t use she/her pronouns would also have their bodies represented by it. Given the erasure of transgender people in medical settings and the negative health outcomes associated (Bauer et al., 2009), it would be ideal to work towards using terminology that doesn’t force them to identify with the wrong gender in order to receive medical care.
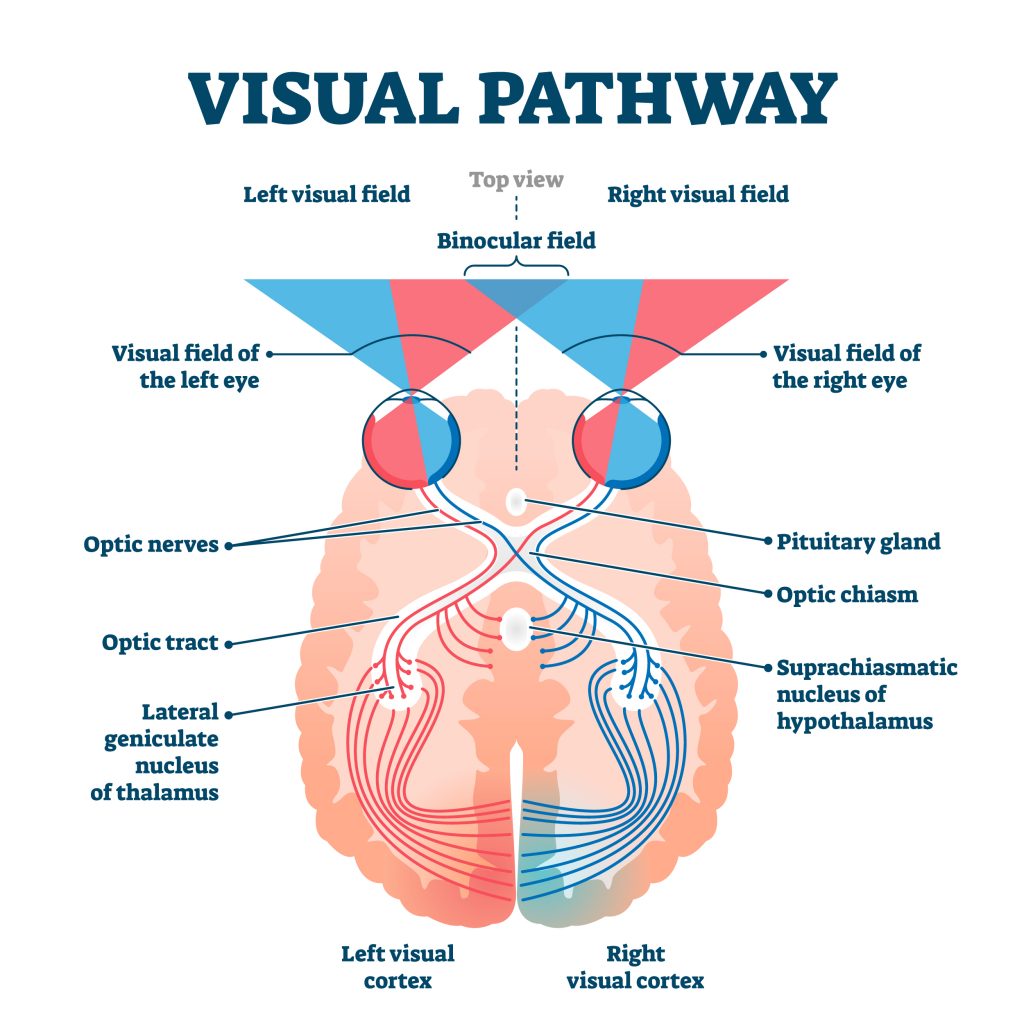
Just like the sense of touch, other senses send information to the cortex in an organized, map-like arrangement. The primary visual cortex is located at the back end of the brain in the occipital lobe, and is the first bit of cortex to receive visual information from the eyes. Unlike the somatosensory system, which sends signals separately from each side of the body, the visual system is a little different because the left and right eyes each capture images from the left and right sides of visual space (See Figure BB.18). The inside part of the right eye and the outside part of the left eye both detect stimuli in the right visual field and the optic nerves carry information from the eye to the brain so the right visual world ALL ends up in the left side of the brain. If you follow the lines in the figure you can see the same arrangement is true for the left visual field.
The primary auditory cortex is the main area responsible for processing incoming auditory information from the ears, and is located within the temporal lobe, tucked inside the lateral fissure. The primary gustatory cortex is responsible for the perception of taste and is found deeper within the lateral fissure that includes a portion of the frontal lobe as well as a structure called the insula. The sense of smell is sent from receptors in the nose to the olfactory bulb that runs along the bottom of the frontal lobe and then to the primary olfactory area in the piriform cortex. These primary sensory areas are important for categorizing and integrating sensory information, which are the first steps in conscious perception so can be considered the main sites of input from the environment. The primary motor area is responsible for voluntary movement, so is one of the main sites of output by the brain. Collectively, these functional areas make up only a small proportion of the total cortical tissue, the rest is referred to as association cortex. It integrates information gathered from other areas to regulate complex thought processes such as problem-solving, decision-making, and language. Unlike the primary sensory and motor areas, electrical stimulation of association cortex does not produce simple movement or sensation.
Other Areas of the Forebrain
Other areas of the forebrain, located beneath the cerebral cortex, include the thalamus and the limbic system. The thalamus is a sensory relay for the brain. All of our senses, with the exception of smell, are routed through the thalamus before being directed to other areas of the brain for processing (Figure BB.19).
The limbic system is involved in processing both emotion and memory. The limbic system is made up of a number of different structures, but three of the most important are the hippocampus, the amygdala, and the hypothalamus (Figure BB.20). The hippocampus is an essential structure for learning and memory. The amygdala is involved in our experience of emotion and in tying emotional meaning to our memories. The hypothalamus regulates a number of homeostatic processes, including the regulation of body temperature, appetite, and blood pressure. The hypothalamus also serves as an interface between the nervous system and the endocrine system and in the regulation of sexual motivation and behaviour.
Lateralization
You may be familiar with the idea that the right and left hemispheres have different abilities or specialized functions, referred to as lateralization. Some of the earliest evidence of lateralization comes from Paul Broca. Broca identified a structure in the frontal lobe now known as Broca’s area, which typically appears on the left hemisphere (Figure BB.21). This discovery came from work with patients with a particular set of language impairments after damage in the Broca’s area, called Broca’s aphasia.
Consider Louis Leborgne or ‘Tan’, Broca’s first patient with damage in this area. Leborgne was described as intelligent and understood language, but wasn’t able to reply with anything other than “tan” or a single swear word if he was angry. Leborgne’s primary communication was a combination of gestures and “tan”, spoken in a variety of tones depending on context (Devinsky & Samuels, 2016). This is why Broca’s aphasia is also called expressive aphasia, because people affected by it cannot produce communicative language in a verbal or written form, though they have no problems with comprehension.
Wernicke’s area, important for speech comprehension, is also located in the left hemisphere, close to the primary auditory cortex. Whereas individuals with damage to Broca’s area have difficulty producing language, those with damage to Wernicke’s area can produce words, but they aren’t able to understand language or combine words in sensible ways (Figure BB. 21). In most people, both Broca’s area and Wernicke’s area are located in the left hemisphere.
These kinds of cases indicate that the left hemisphere may have some specialized control of verbal language. For most people, the left hemisphere is needed for verbal language, while the right hemisphere may be better at some kinds of comprehension and symbol recognition (Taylor & Regard, 2003). It’s likely that both hemispheres need to interact to produce a full range of language functions.
More evidence for lateralization comes from Michael Gazzaniga and his colleagues, who studied the function of each hemisphere independently in patients who had undergone ‘split-brain’ surgery. This surgery is used to stop the spread of seizures from one hemisphere to the other in some cases of severe epilepsy. To accomplish this the surgeon must cut the corpus callosum, a band of about 200 million axons that allows for communication between the two hemispheres (Figure BB.22). Because the two sides normally share the information they have processed, we aren’t aware of the different roles they play in day-to-day function.
This is not the case for split-brain patients. For instance, if you show a picture to the patient’s left visual field only, they won’t be able to name it because the information is only available in the largely nonverbal right hemisphere. However, they can recreate the picture with their left hand, which is also controlled by the right hemisphere. When the more verbal left hemisphere sees the picture that the hand drew, the patient is able to name it (assuming the left hemisphere can interpret what was drawn by the left hand).
More data from Gazzinga and associates suggests that a variety of functions show patterns indicating some degree of hemispheric dominance (Gazzaniga, 2005). For example, the left hemisphere may be superior for forming associations in memory, selective attention, and positive emotions. The right hemisphere, on the other hand, may be superior in pitch perception, arousal, and negative emotions (Ehret, 2006). It’s tempting to conclude that certain behaviours can be attributed to one hemisphere or the other, but research in this area produces inconsistent results and there’s a natural variation of brain organization in every population of humans (Banich & Heller, 1998).
If the video above does not load, click here: https://youtu.be/uHN-IrVAoJY
For a full transcript of this video, click here
Brain Imaging
Techniques Involving Radiation
A computerized tomography (CT) scan involves taking a number of x-rays of a particular section of a person’s body or brain (Figure BB.23). The x-rays pass through tissues of different densities at different rates, allowing a computer to construct an overall image of the area of the body being scanned. A CT scan is often used to determine whether someone has a tumour or significant brain damage.
Positron emission tomography (PET) scans create pictures of the living, active brain (Figure BB.24). An individual receiving a PET scan drinks or is injected with a mildly radioactive substance, called a tracer. Once in the bloodstream, the amount of tracer in any given region of the brain can be monitored. As a brain area becomes more active, more blood flows to that area. A computer monitors the movement of the tracer and creates a rough map of active and inactive areas of the brain during a given behaviour. PET scans show little detail, are unable to pinpoint events precisely in time, and require that the brain be exposed to radiation; therefore, this technique has been replaced by the fMRI as an alternative diagnostic tool. However, combined with CT, PET technology is still being used in certain contexts. For example, CT/PET scans allow better imaging of the activity of neurotransmitter receptors and open new avenues in schizophrenia research. In this hybrid CT/PET technology, CT contributes clear images of brain structures, while PET shows the brain’s activity.
Techniques Involving Magnetic Fields
In magnetic resonance imaging (MRI), a person is placed inside a machine that generates a strong magnetic field. The magnetic field causes the hydrogen atoms in the body’s cells to move. When the magnetic field is turned off, the hydrogen atoms emit electromagnetic signals as they return to their original positions. Tissues of different densities give off different signals, which a computer interprets and displays on a monitor. Functional magnetic resonance imaging (fMRI) operates on the same principles, but it shows changes in brain activity over time by tracking blood flow and oxygen levels. The fMRI provides more detailed images of the brain’s structure, as well as better accuracy in time, than is possible in PET scans (Figure BB.25). With their high level of detail, MRI and fMRI are often used to compare the brains of healthy individuals to the brains of individuals with psychological disorders. This comparison helps determine what structural and functional differences exist between these populations.
LINK TO LEARNING
Techniques Involving Electrical Activity
In some situations, it is helpful to gain an understanding of the overall activity of a person’s brain, without needing information on the actual location of the activity. Electroencephalography (EEG) serves this purpose by providing a measure of a brain’s electrical activity. An array of electrodes is placed around a person’s head (Figure BB.26). The signals received by the electrodes result in a printout of the electrical activity of his or her brain, or brainwaves, showing both the frequency (number of waves per second) and amplitude (height) of the recorded brainwaves, with an accuracy within milliseconds. Such information is especially helpful to researchers studying sleep patterns among individuals with sleep disorders.
